
Between the 1999-00 and 2008-09 seasons, Elton Brand had the most points per game for the Los Angeles Clippers, with 20.3 per game.
Showing
| NAME | PPG | GP | MPG | RPG | APG | SPG | BPG | FGM | FGA | FG% | 3PM | 3PA | 3P% | FTM | FTA | FT% | TS% | OREB | DREB | TPG | MIN | PTS | REB | AST | STL | BLK | TOV | PF | +/- | ||
|---|---|---|---|---|---|---|---|---|---|---|---|---|---|---|---|---|---|---|---|---|---|---|---|---|---|---|---|---|---|---|---|
| 1 | 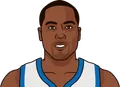 | E. Brand | 20.3 | 459 | 38.3 | 10.3 | 2.7 | 1.0 | 2.3 | 7.7 | 15.0 | 51.4 | 0.0 | 0.0 | 22.2 | 4.9 | 6.5 | 75.2 | 56.9 | 3.9 | 6.4 | 2.4 | 17,595 | 9,336 | 4,710 | 1,242 | 438 | 1,039 | 1,102 | 1,413 | -66 |
| 2 |  | C. Maggette | 17.3 | 512 | 30.8 | 5.2 | 2.4 | 0.8 | 0.2 | 5.2 | 11.7 | 44.8 | 0.7 | 2.2 | 33.1 | 6.1 | 7.4 | 82.4 | 57.8 | 1.1 | 4.1 | 2.4 | 15,780 | 8,835 | 2,673 | 1,229 | 421 | 93 | 1,245 | 1,446 | -666 |
| 3 | | M. Taylor | 17.1 | 62 | 35.9 | 6.5 | 1.6 | 0.8 | 0.8 | 7.4 | 15.9 | 46.4 | 0.0 | 0.1 | 12.5 | 2.3 | 3.2 | 71.1 | 49.2 | 1.5 | 4.9 | 2.7 | 2,227 | 1,060 | 400 | 101 | 51 | 48 | 169 | 217 | -589 |
| 4 | | D. Anderson | 16.9 | 64 | 34.4 | 4.0 | 3.4 | 1.4 | 0.2 | 5.9 | 13.4 | 43.8 | 0.9 | 2.8 | 30.9 | 4.2 | 4.8 | 87.7 | 54.2 | 1.3 | 2.8 | 2.6 | 2,201 | 1,080 | 258 | 220 | 90 | 11 | 167 | 149 | -580 |
| 5 |  | E. Gordon | 16.1 | 78 | 34.3 | 2.6 | 2.8 | 1.0 | 0.4 | 5.3 | 11.6 | 45.6 | 1.7 | 4.3 | 38.9 | 3.8 | 4.5 | 85.4 | 59.3 | 0.6 | 2.0 | 2.1 | 2,677 | 1,252 | 201 | 215 | 78 | 35 | 164 | 172 | -457 |
| 6 | | L. Odom | 15.9 | 230 | 36.0 | 7.3 | 4.6 | 1.0 | 1.3 | 5.9 | 13.2 | 44.4 | 0.9 | 2.7 | 31.3 | 3.3 | 4.7 | 70.9 | 52.0 | 1.6 | 5.8 | 3.3 | 8,281 | 3,656 | 1,689 | 1,058 | 230 | 294 | 759 | 799 | -795 |
| 7 |  | B. Davis | 14.9 | 65 | 34.6 | 3.7 | 7.7 | 1.7 | 0.5 | 5.5 | 14.8 | 37.0 | 1.5 | 5.0 | 30.2 | 2.4 | 3.2 | 75.7 | 46.0 | 0.7 | 3.0 | 3.0 | 2,248 | 968 | 238 | 501 | 108 | 35 | 193 | 193 | -350 |
| 8 | | A. Thornton | 14.7 | 150 | 32.1 | 4.8 | 1.3 | 0.7 | 0.7 | 5.6 | 12.8 | 43.9 | 0.4 | 1.4 | 30.1 | 3.0 | 4.0 | 74.9 | 50.3 | 1.5 | 3.4 | 1.7 | 4,812 | 2,199 | 726 | 201 | 105 | 105 | 258 | 422 | -971 |
| 9 | | S. Cassell | 14.6 | 174 | 28.9 | 3.2 | 5.4 | 0.7 | 0.1 | 5.4 | 12.3 | 43.8 | 0.7 | 2.0 | 32.9 | 3.2 | 3.7 | 87.3 | 52.6 | 0.5 | 2.8 | 2.0 | 5,035 | 2,545 | 559 | 940 | 130 | 22 | 354 | 420 | +234 |
| 10 | | C. Mobley | 13.8 | 245 | 36.3 | 3.7 | 2.7 | 1.1 | 0.4 | 5.1 | 11.9 | 43.3 | 1.1 | 2.9 | 36.6 | 2.5 | 3.0 | 83.0 | 52.4 | 0.7 | 3.1 | 1.8 | 8,887 | 3,382 | 912 | 650 | 278 | 96 | 431 | 567 | -413 |
| 11 |  | A. Miller | 13.6 | 80 | 36.4 | 4.0 | 6.7 | 1.2 | 0.1 | 4.7 | 11.6 | 40.6 | 0.3 | 1.4 | 21.3 | 3.9 | 4.9 | 79.5 | 49.5 | 1.1 | 2.9 | 2.6 | 2,913 | 1,088 | 316 | 537 | 99 | 11 | 206 | 203 | -293 |
| 12 | | J. McInnis | 12.9 | 187 | 34.5 | 2.7 | 5.5 | 0.8 | 0.1 | 5.2 | 12.0 | 43.5 | 0.7 | 2.1 | 33.6 | 1.7 | 2.1 | 82.1 | 49.9 | 0.6 | 2.1 | 1.5 | 6,458 | 2,410 | 505 | 1,036 | 153 | 15 | 287 | 456 | -506 |
| 13 | | B. Simmons | 12.7 | 131 | 31.9 | 5.4 | 2.3 | 1.2 | 0.3 | 4.7 | 10.6 | 44.7 | 0.4 | 1.0 | 40.9 | 2.8 | 3.4 | 84.2 | 52.6 | 1.9 | 3.5 | 1.6 | 4,175 | 1,666 | 708 | 301 | 157 | 33 | 208 | 396 | +16 |
| 14 | | T. Nesby | 12.4 | 87 | 30.5 | 3.6 | 1.5 | 1.0 | 0.4 | 4.6 | 11.9 | 38.9 | 1.2 | 3.8 | 31.8 | 1.9 | 2.5 | 79.0 | 47.7 | 1.1 | 2.5 | 1.3 | 2,650 | 1,081 | 317 | 132 | 85 | 35 | 112 | 233 | -680 |
| 15 | | Q. Richardson | 12.0 | 281 | 25.7 | 4.6 | 1.4 | 0.8 | 0.2 | 4.5 | 10.9 | 41.1 | 1.3 | 3.7 | 35.0 | 1.7 | 2.4 | 71.0 | 50.0 | 1.6 | 2.9 | 1.3 | 7,216 | 3,362 | 1,286 | 381 | 222 | 57 | 371 | 462 | -363 |
| 16 | | T. Thomas | 11.5 | 149 | 28.3 | 5.0 | 2.4 | 0.7 | 0.4 | 4.2 | 10.2 | 41.1 | 1.5 | 4.3 | 34.8 | 1.6 | 2.2 | 71.9 | 51.4 | 0.9 | 4.1 | 1.5 | 4,214 | 1,711 | 747 | 352 | 98 | 58 | 218 | 446 | -124 |
| 17 | | C. Kaman | 10.4 | 385 | 29.1 | 8.3 | 1.2 | 0.5 | 1.5 | 4.2 | 8.6 | 48.8 | 0.0 | 0.0 | 0.0 | 2.1 | 2.8 | 73.4 | 53.2 | 2.2 | 6.0 | 2.2 | 11,215 | 4,008 | 3,180 | 469 | 185 | 565 | 841 | 1,185 | -701 |
| 18 | | M. Camby | 10.3 | 62 | 31.0 | 11.1 | 2.0 | 0.8 | 2.1 | 4.1 | 8.0 | 51.2 | 0.0 | 0.1 | 25.0 | 2.1 | 2.9 | 72.5 | 55.6 | 2.6 | 8.5 | 1.5 | 1,925 | 641 | 690 | 127 | 51 | 132 | 93 | 129 | -206 |
| 19 | | M. Olowokandi | 10.1 | 278 | 30.8 | 8.0 | 0.8 | 0.5 | 1.7 | 4.3 | 10.0 | 43.4 | 0.0 | 0.0 | 1.4 | 2.3 | 61.8 | 45.8 | 2.1 | 5.9 | 2.2 | 8,557 | 2,810 | 2,220 | 221 | 138 | 472 | 619 | 881 | -1179 | |
| 20 | | E. Piatkowski | 9.5 | 289 | 24.0 | 2.8 | 1.2 | 0.6 | 0.2 | 3.3 | 7.5 | 43.8 | 1.4 | 3.4 | 41.3 | 1.5 | 1.8 | 86.2 | 57.4 | 0.7 | 2.0 | 0.9 | 6,934 | 2,741 | 803 | 359 | 164 | 53 | 253 | 465 | -524 |
| 21 | | D. Miles | 9.4 | 163 | 26.7 | 5.7 | 1.7 | 0.7 | 1.4 | 3.8 | 7.8 | 49.3 | 0.0 | 0.2 | 10.5 | 1.7 | 3.0 | 57.2 | 51.7 | 1.4 | 4.3 | 1.9 | 4,360 | 1,540 | 930 | 283 | 122 | 228 | 307 | 375 | +36 |
| 22 | | T. Hudson | 8.8 | 62 | 25.7 | 2.4 | 3.9 | 0.7 | 0.0 | 3.3 | 8.7 | 37.7 | 1.0 | 3.1 | 31.1 | 1.2 | 1.5 | 81.1 | 46.8 | 0.5 | 1.9 | 1.7 | 1,592 | 545 | 148 | 242 | 43 | 0 | 108 | 65 | -348 |
| 23 | | M. Jaric | 8.5 | 174 | 27.6 | 2.9 | 4.5 | 1.6 | 0.3 | 3.2 | 7.9 | 40.1 | 0.9 | 2.7 | 34.3 | 1.2 | 1.7 | 73.6 | 49.0 | 0.6 | 2.3 | 1.8 | 4,795 | 1,478 | 496 | 777 | 274 | 48 | 316 | 364 | -33 |
| 24 |  | S. Livingston | 7.4 | 145 | 27.2 | 3.1 | 4.8 | 0.9 | 0.5 | 3.1 | 7.0 | 44.0 | 0.0 | 0.2 | 23.1 | 1.2 | 1.7 | 71.0 | 47.9 | 0.8 | 2.3 | 2.0 | 3,950 | 1,077 | 456 | 698 | 137 | 72 | 294 | 377 | -244 |
| 25 | | F. Jones | 7.3 | 52 | 28.8 | 2.4 | 3.6 | 1.0 | 0.2 | 2.5 | 6.1 | 40.7 | 1.0 | 2.8 | 36.7 | 1.3 | 1.6 | 81.5 | 53.6 | 0.4 | 2.0 | 1.3 | 1,495 | 378 | 126 | 188 | 53 | 11 | 66 | 112 | -261 |
More NBA News
Cooper Flagg and Kyrie Irving will miss the Mavericks' game against the Spurs

Magic forward Paolo Banchero has a high ankle sprain, likely will miss weeks

LeBron James ruled out for Sixers' game against Bucks, the first in a back-to-back

Knicks try to clear up 'misinformation' about rings, say employees will get them in 4-6 weeks
Amen Thompson blocks Wembanyama in final second as the Rockets beat the Spurs 114-110 in Austin

Cameron Boozer hits go-ahead jumper with 20 seconds left, Grizzlies rally to beat Warriors 111-108

More Clippers Stats
Team Leaders 


PPG
28.0
Garland
RPG
7.5
Lopez
APG
6.0
Dunn
Team Rankings
ORTG
116.0
9th
DRTG
107.7
10th
NETRTG
8.3
10th
3P%
41.7
3rd
2026-27 Conference Standings
| TEAM | W | L | PCT | GB | |
|---|---|---|---|---|---|
5 | 2 | 0 | 1.000 | ||
6 | 2 | 0 | 1.000 | ||
7 |  Clippers | 1 | 1 | .500 | 1.0 |
8 | 1 | 1 | .500 | 1.0 | |
9 | 1 | 1 | .500 | 1.0 |
 Grizzlies
 Timberwolves
 Jazz
 Mavericks
 OKC
 LAL
 GSW
 TOR


NBA 2026-27 Leaders








NBA 2026-27 Rankings


NBA Fantasy 2026-27





NBA 2026-27 Betting


NBA 2026-27 Standings
| Eastern | W | L | PCT | GB | |
|---|---|---|---|---|---|
| 1 | 2 | 0 | 1.000 | ||
| 2 | 2 | 0 | 1.000 | ||
| 3 | 2 | 0 | 1.000 | ||
| 4 | 2 | 0 | 1.000 | ||
| 5 | 2 | 1 | .667 | 0.5 | |
| 6 | 1 | 1 | .500 | 1.0 | |
| 7 | 1 | 1 | .500 | 1.0 | |
| 8 | 1 | 1 | .500 | 1.0 | |
| 9 | 1 | 1 | .500 | 1.0 | |
| 10 | 0 | 1 | .000 | 1.5 | |
| 11 | 0 | 1 | .000 | 1.5 | |
| 12 | 0 | 2 | .000 | 2.0 | |
| 13 | 0 | 2 | .000 | 2.0 | |
| 14 | 0 | 2 | .000 | 2.0 | |
| 15 | 0 | 3 | .000 | 2.5 |
 Hawks
 Pistons
 76ers
 Hornets
 Wizards
 Celtics
 Bulls
 Pacers
 Nets
 Cavaliers
 Magic
 Knicks
 Bucks
 Heat
| Western | W | L | PCT | GB | |
|---|---|---|---|---|---|
| 1 | 2 | 0 | 1.000 | ||
| 2 | 2 | 0 | 1.000 | ||
| 3 | 2 | 0 | 1.000 | ||
| 4 | 2 | 0 | 1.000 | ||
| 5 | 2 | 0 | 1.000 | ||
| 6 | 2 | 0 | 1.000 | ||
| 7 | 1 | 1 | .500 | 1.0 | |
| 8 | 1 | 1 | .500 | 1.0 | |
| 9 | 1 | 1 | .500 | 1.0 | |
| 10 | 0 | 1 | .000 | 1.5 | |
| 11 | 0 | 1 | .000 | 1.5 | |
| 12 | 0 | 2 | .000 | 2.0 | |
| 13 | 0 | 2 | .000 | 2.0 | |
| 14 | 0 | 2 | .000 | 2.0 | |
| 15 | 0 | 2 | .000 | 2.0 |
 Rockets
 Trail Blazers
 Nuggets
 Suns
 Pelicans
 Spurs
 Kings