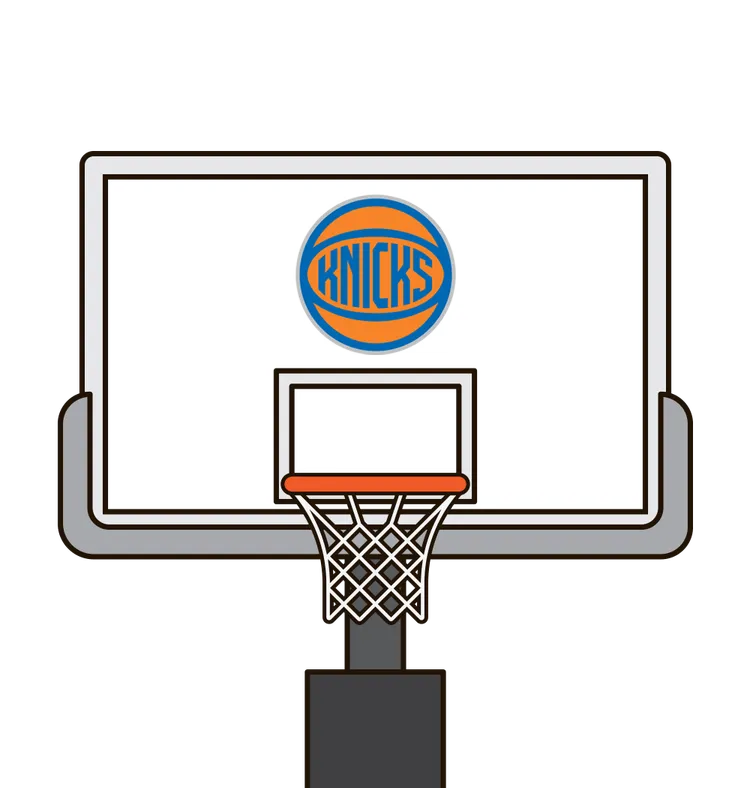
Hawks
Knicks
FG Made - Attempted
34-79
37-94
Field Goal %
43.0
39.4
3PT Made - Attempted
0
1
3PT %
FT Made - Attempted
32-50
18-30
Free Throw %
64.0
60.0
Rebounds
50
49
Offensive Rebounds
Defensive Rebounds
Assists
17
22
Steals
Blocks
Turnovers
Personal Fouls
27
35
| NAME | MIN | PTS | REB | AST | STL | BLK | FG | 3PT | FT | TOV | PF | +/- | OREB | DREB | FG% | 3P% | FT% |
|---|---|---|---|---|---|---|---|---|---|---|---|---|---|---|---|---|---|
| John Drew | 41 | 30 | 11 | 0 | 9-18 | 0 | 12-19 | 4 | 50.0 | 63.2 | |||||||
| Eddie Johnson | 33 | 16 | 1 | 4 | 7-14 | 0 | 2-2 | 3 | 50.0 | 100.0 | |||||||
| Dan Roundfield | 31 | 11 | 6 | 1 | 5-9 | 0 | 1-4 | 4 | 55.6 | 25.0 | |||||||
| Wes Matthews | 29 | 9 | 3 | 3 | 3-10 | 0 | 3-4 | 3 | 30.0 | 75.0 | |||||||
| Sam Pellom | 23 | 11 | 7 | 0 | 4-7 | 0 | 3-6 | 4 | 57.1 | 50.0 | |||||||
| Steve Hawes | 22 | 4 | 7 | 3 | 0-4 | 0 | 4-4 | 3 | 0.0 | 100.0 | |||||||
| Tom McMillen | 20 | 10 | 6 | 0 | 4-6 | 0 | 2-2 | 2 | 66.7 | 100.0 | |||||||
| Charlie Criss | 17 | 4 | 2 | 2 | 1-4 | 0 | 2-2 | 0 | 25.0 | 100.0 | |||||||
| Art Collins | 15 | 3 | 1 | 3 | 0-3 | 0 | 3-5 | 0 | 0.0 | 60.0 | |||||||
| Tom Burleson | 5 | 2 | 3 | 0 | 1-4 | 0-0 | 0-0 | 2 | 25.0 | ||||||||
| Craig Shelton | 4 | 0 | 3 | 1 | 0-0 | 0-0 | 0-2 | 2 | 0.0 |
| NAME | MIN | PTS | REB | AST | STL | BLK | FG | 3PT | FT | TOV | PF | +/- | OREB | DREB | FG% | 3P% | FT% |
|---|---|---|---|---|---|---|---|---|---|---|---|---|---|---|---|---|---|
| Micheal Ray Richardson | 40 | 13 | 8 | 4 | 5-14 | 0-5 | 3-4 | 2 | 35.7 | 0.0 | 75.0 | ||||||
| Campy Russell | 33 | 14 | 8 | 2 | 5-13 | 0 | 4-4 | 5 | 38.5 | 100.0 | |||||||
| Ray Williams | 31 | 17 | 5 | 4 | 7-20 | 1 | 2-3 | 5 | 35.0 | 66.7 |
| NAME | MIN | PTS | REB | AST | STL | BLK | FG | 3PT | FT | TOV | PF | +/- | OREB | DREB | FG% | 3P% | FT% |
|---|---|---|---|---|---|---|---|---|---|---|---|---|---|---|---|---|---|
| Reggie Carter | 8 | 2 | 0 | 3 | 0-4 | 0 | 2-5 | 0 | 0 | 0 | 0.0 | 40.0 |
| NAME | MIN | PTS | REB | AST | STL | BLK | FG | 3PT | FT | TOV | PF | +/- | OREB | DREB | FG% | 3P% | FT% |
|---|---|---|---|---|---|---|---|---|---|---|---|---|---|---|---|---|---|
| Marvin Webster | 29 | 7 | 9 | 2 | 3-8 | 0 | 1-5 | 4 | 37.5 | 20.0 | |||||||
| Sly Williams | 20 | 11 | 4 | 2 | 5-8 | 0 | 1-2 | 4 | 62.5 | 50.0 | |||||||
| Bill Cartwright | 20 | 7 | 7 | 0 | 3-6 | 0 | 1-3 | 6 | 50.0 | 33.3 | |||||||
| Mike Glenn | 17 | 4 | 1 | 3 | 1-3 | 0 | 2-2 | 3 | 33.3 | 100.0 | |||||||
| Mike Woodson | 15 | 9 | 0 | 1 | 4-9 | 0 | 1-1 | 2 | 0 | 0 | 44.4 | 100.0 | |||||
| DeWayne Scales | 14 | 5 | 3 | 0 | 2-2 | 0-0 | 1-1 | 0 | 100.0 | 100.0 | |||||||
| Larry Demic | 13 | 4 | 4 | 1 | 2-7 | 0 | 0-0 | 4 | 28.6 |
Playoff PPG Leaders
See moreEmbiid

Siakam

Lillard

Playoff RPG Leaders
See moreJokic

Allen

Zubac

Playoff APG Leaders
See moreHaliburton

James

Herro

Playoff SPG Leaders
See moreIrving

Edwards

Alexander-Walker

Playoff BPG Leaders
See moreHolmgren

Lopez

Mobley

Playoff 3PM Leaders
See moreLillard
Doncic

Herro
Playoff TS% Leaders
See moreWright

Hauser

White

Playoff ORtg Rankings
See more
121.6

121.2

118.9

118.8

118.5

116.3
Playoff DRtg Rankings
See more
98.2
99.4
100.3

103.2

105.6
109.2
Playoff NetRtg Rankings
See more 19.6
18.5
7.1
5.5
5.0
4.9
Playoff Tank Leaderboard
See more
0-2
0-2

0-3
1-2
1-2

1-1
Best Record ATS
See more 52-33

49-35
50-36
47-36-1

45-35-2

45-37-2
Worst Record ATS
See more
29-54
34-48

36-48
36-47-1

36-46

34-44-4
Scores


 Celtics
  Knicks
  Bucks
Bucks  Cavaliers
  Magic
Magic  PHI
PHI  Pacers
  Thunder
  Nuggets
  Timberwolves
  Clippers
  Mavericks
  LAL
LAL  NOP
NOP  MIA
MIA