
Showing
| POSITION | OPP | S/GP | S | GP | G | A | P | +/- | PIM | PPG | PPA | SHG | SHA | GWG | OTG | S% | FOW | FO | FOW% | HIT | BKS | TKA | GVA | TOI/GP | |
|---|---|---|---|---|---|---|---|---|---|---|---|---|---|---|---|---|---|---|---|---|---|---|---|---|---|
| 1 | Center | 7.14 | 207 | 29 | 20 | 42 | 62 | +13 | 89 | 1 | 8 | 1 | 2 | 4 | 0 | 9.7 | 283 | 562 | 50.4 | 49 | 40 | 23 | 12 | 80:03 | |
| 2 | Center | 10.09 | 323 | 32 | 32 | 56 | 88 | -24 | 140 | 11 | 17 | 1 | 3 | 5 | 0 | 9.9 | 398 | 771 | 51.6 | 114 | 38 | 27 | 21 | 83:30 | |
| 3 | Center | 10.58 | 254 | 24 | 27 | 46 | 73 | +1 | 55 | 4 | 11 | 0 | 1 | 3 | 1 | 10.6 | 104 | 210 | 49.5 | 23 | 7 | 13 | 12 | 88:11 | |
| 4 | Center | 8.68 | 217 | 25 | 28 | 40 | 68 | +4 | 47 | 3 | 11 | 2 | 0 | 4 | 0 | 12.9 | 211 | 455 | 46.4 | 77 | 29 | 19 | 18 | 86:17 | |
| 5 | Center | 8.78 | 237 | 27 | 22 | 42 | 64 | -5 | 45 | 7 | 12 | 0 | 0 | 1 | 1 | 9.3 | 334 | 655 | 51.0 | 61 | 47 | 36 | 30 | 80:09 | |
| 6 | Center | 7.50 | 210 | 28 | 21 | 40 | 61 | -34 | 51 | 3 | 12 | 1 | 0 | 2 | 0 | 10.0 | 273 | 552 | 49.5 | 72 | 24 | 20 | 21 | 83:11 | |
| 7 | Center | 11.20 | 56 | 5 | 9 | 14 | 23 | +15 | 6 | 1 | 3 | 0 | 0 | 2 | 0 | 16.1 | |||||||||
| 8 | Center | 7.77 | 202 | 26 | 27 | 41 | 68 | +10 | 75 | 7 | 12 | 1 | 0 | 3 | 0 | 13.4 | 323 | 633 | 51.0 | 47 | 33 | 28 | 27 | 84:38 | |
| 9 | Center | 7.25 | 174 | 24 | 17 | 38 | 55 | +17 | 61 | 5 | 7 | 0 | 0 | 5 | 1 | 9.8 | 216 | 456 | 47.4 | 42 | 29 | 17 | 27 | 73:18 | |
| 10 | Center | 8.23 | 181 | 22 | 23 | 30 | 53 | -3 | 63 | 8 | 9 | 4 | 1 | 4 | 0 | 12.7 | 220 | 445 | 49.4 | 33 | 24 | 20 | 12 | 73:39 | |
| 11 | Center | 8.32 | 258 | 31 | 31 | 42 | 73 | -7 | 102 | 6 | 12 | 1 | 1 | 3 | 0 | 12.0 | 301 | 616 | 48.9 | 66 | 28 | 20 | 10 | 74:57 | |
| 12 | Center | 7.61 | 137 | 18 | 17 | 30 | 47 | -10 | 67 | 4 | 12 | 1 | 0 | 2 | 0 | 12.4 | 135 | 240 | 56.3 | 29 | 10 | 10 | 7 | 72:49 | |
| 13 | Center | 7.86 | 173 | 22 | 20 | 28 | 48 | -2 | 40 | 3 | 10 | 2 | 1 | 3 | 0 | 11.6 | 251 | 496 | 50.6 | 27 | 20 | 17 | 20 | 68:50 | |
| 14 | Center | 6.76 | 142 | 21 | 20 | 29 | 49 | -19 | 46 | 3 | 6 | 1 | 0 | 3 | 0 | 14.1 | 177 | 342 | 51.8 | 23 | 20 | 11 | 7 | 76:44 | |
| 15 | Center | 8.63 | 207 | 24 | 21 | 34 | 55 | +5 | 51 | 6 | 10 | 0 | 0 | 1 | 0 | 10.1 | 332 | 654 | 50.8 | 80 | 34 | 19 | 27 | 77:19 | |
| 16 | Center | 8.90 | 187 | 21 | 18 | 25 | 43 | -16 | 150 | 0 | 9 | 2 | 0 | 2 | 1 | 9.6 | 255 | 539 | 47.3 | 63 | 28 | 27 | 12 | 81:06 | |
| 17 | Center | 7.95 | 167 | 21 | 19 | 34 | 53 | +7 | 59 | 5 | 8 | 1 | 1 | 4 | 0 | 11.4 | 234 | 454 | 51.5 | 59 | 18 | 23 | 11 | 75:39 | |
| 18 | Center | 9.26 | 213 | 23 | 29 | 28 | 57 | -4 | 59 | 5 | 9 | 1 | 1 | 3 | 0 | 13.6 | 292 | 557 | 52.4 | 46 | 22 | 29 | 18 | 81:54 | |
| 19 | Center | 8.05 | 161 | 20 | 17 | 37 | 54 | -20 | 35 | 3 | 12 | 0 | 1 | 0 | 0 | 10.6 | 313 | 638 | 49.1 | 78 | 27 | 26 | 34 | 81:38 | |
| 20 | Center | 7.75 | 155 | 20 | 22 | 35 | 57 | -2 | 71 | 6 | 6 | 0 | 1 | 4 | 1 | 14.2 | 245 | 488 | 50.2 | 41 | 25 | 26 | 18 | 78:25 | |
| 21 | Center | 8.48 | 178 | 21 | 24 | 40 | 64 | +16 | 53 | 5 | 11 | 2 | 2 | 2 | 0 | 13.5 | 335 | 673 | 49.8 | 65 | 33 | 26 | 32 | 80:11 | |
| 22 | Center | 8.53 | 128 | 15 | 14 | 25 | 39 | +12 | 39 | 4 | 11 | 0 | 2 | 4 | 0 | 10.9 | 294 | 550 | 53.5 | 72 | 40 | 24 | 20 | 80:36 | |
| 23 | Center | 6.87 | 103 | 15 | 8 | 25 | 33 | +2 | 31 | 0 | 7 | 1 | 1 | 1 | 0 | 7.8 | 273 | 551 | 49.5 | 69 | 32 | 39 | 15 | 82:24 | |
| 24 | Center | 9.00 | 90 | 10 | 15 | 20 | 35 | +7 | 21 | 3 | 5 | 0 | 0 | 1 | 0 | 16.7 | 216 | 422 | 51.2 | 45 | 13 | 16 | 18 | 80:46 | |
| 25 | Center | 7.25 | 87 | 12 | 10 | 21 | 31 | +5 | 37 | 3 | 5 | 0 | 0 | 1 | 1 | 11.5 | 220 | 434 | 50.7 | 29 | 25 | 21 | 24 | 70:32 | |
 Canadiens
 Maple Leafs
 Bruins
 Rangers
 Blackhawks
 Red Wings
 Kings
 Stars
 Flyers
 Penguins
 Blues
 Sabres
 Flames
 Islanders
 Canucks
 Devils
 Capitals
 Hurricanes
 Avalanche
 Oilers
 Coyotes
 Lightning
 Sharks
 Ducks
More NHL News
Hellebuyck says incidents 'more than online death threats' led him to ask the Jets to trade him

Kraken and Hurricanes land in Helsinki, with Finnish players serving as tour guides, translators

Ivar Stenberg leads the Sharks past the Islanders 3-2 in a shootout to stop their 5-game skid

Flyers hold off the Canucks 3-1 in a matchup of struggling squads

Draisaitl scores twice and McDavid nets goal to extend point streak as Oilers top Rangers 3-1

Jets coach criticizes Devils' decision not to play Connor Hellebuyck in Winnipeg
More Sabres Stats
Team Leaders 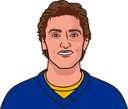

G
10
Thompson
A
13
Benson
+/-
+11
Benson
Team Rankings
G/GP
2.94
21st
GA/GP
3.29
20th
PP%
14.3
30th
PK%
71.2
26th
 Senators
 Panthers
 Sabres


NHL 2026-27 Leaders

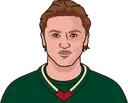


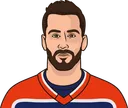




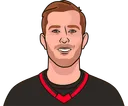


NHL 2026-27 Rankings


NHL 2026-27 Betting


NHL 2026-27 Standings
| Atlantic Division | W | L | OTL | PTS | DIFF |
|---|---|---|---|---|---|
13 | 4 | 1 | 27 | 27 | |
11 | 3 | 3 | 25 | 8 | |
11 | 4 | 2 | 24 | 10 | |
11 | 6 | 1 | 23 | 4 | |
9 | 7 | 2 | 20 | 1 | |
8 | 6 | 3 | 19 | -7 | |
8 | 9 | 2 | 18 | 0 | |
7 | 8 | 3 | 17 | -7 | |
| Metropolitan Division | W | L | OTL | PTS | DIFF |
14 | 3 | 2 | 30 | 33 | |
13 | 5 | 0 | 26 | 15 | |
10 | 8 | 1 | 21 | 1 | |
9 | 6 | 0 | 18 | 2 | |
7 | 6 | 4 | 18 | -3 | |
5 | 10 | 5 | 15 | -21 | |
7 | 8 | 0 | 14 | -7 | |
6 | 10 | 2 | 14 | -7 |
 Blue Jackets
| Central Division | W | L | OTL | PTS | DIFF |
|---|---|---|---|---|---|
12 | 3 | 4 | 28 | 20 | |
10 | 5 | 2 | 22 | 8 | |
10 | 6 | 2 | 22 | 16 | |
8 | 4 | 5 | 21 | 1 | |
10 | 7 | 1 | 21 | 0 | |
7 | 8 | 3 | 17 | -14 | |
7 | 8 | 2 | 16 | -3 | |
4 | 13 | 1 | 9 | -37 | |
| Pacific Division | W | L | OTL | PTS | DIFF |
13 | 3 | 3 | 29 | 22 | |
12 | 5 | 2 | 26 | 13 | |
10 | 7 | 1 | 21 | 3 | |
9 | 6 | 1 | 19 | 0 | |
8 | 9 | 1 | 17 | -17 | |
8 | 11 | 1 | 17 | -20 | |
5 | 8 | 2 | 12 | -7 | |
3 | 16 | 1 | 7 | -34 |
 Wild
 Predators
 Mammoth
 Jets
 Blues
 Golden Knights
 Ducks
 Kraken