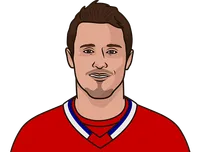
| TEAM | W | GP | L | OTL | PTS | PTS% | SOW | SOL | G | GA | DIFF | PP% | PK% | S/GP | S% | SA/GP | SV% | ||
|---|---|---|---|---|---|---|---|---|---|---|---|---|---|---|---|---|---|---|---|
| 1 |  | Canadiens | 158 | 328 | 134 | 36 | 352 | .537 | 13 | 11 | 892 | 925 | -33 | 17.6 | 79.4 | 31.85 | 8.5 | 30.59 | .908 |
| 2 |  | Maple Leafs | 164 | 328 | 123 | 41 | 369 | .563 | 14 | 18 | 998 | 953 | 45 | 21.3 | 81.4 | 32.04 | 9.5 | 32.53 | .911 |
| 3 |  | Bruins | 185 | 328 | 106 | 37 | 407 | .620 | 11 | 11 | 992 | 860 | 132 | 23.0 | 82.9 | 32.70 | 9.3 | 28.96 | .909 |
| 4 |  | Rangers | 160 | 328 | 130 | 38 | 358 | .546 | 15 | 16 | 935 | 961 | -26 | 19.9 | 79.4 | 29.59 | 9.6 | 32.41 | .910 |
| 5 |  | Blackhawks | 166 | 328 | 122 | 40 | 372 | .567 | 9 | 6 | 969 | 964 | 5 | 19.2 | 77.5 | 31.91 | 9.3 | 32.47 | .909 |
| 6 |  | Red Wings | 136 | 328 | 145 | 47 | 319 | .486 | 19 | 11 | 843 | 989 | -146 | 17.4 | 79.3 | 29.42 | 8.7 | 31.46 | .904 |
| 7 |  | Kings | 163 | 328 | 134 | 31 | 357 | .544 | 9 | 12 | 858 | 854 | 4 | 18.9 | 82.0 | 30.73 | 8.5 | 28.93 | .910 |
| 8 |  | Stars | 169 | 328 | 124 | 35 | 373 | .569 | 8 | 9 | 927 | 910 | 17 | 20.1 | 79.8 | 31.12 | 9.1 | 30.02 | .908 |
| 9 |  | Flyers | 159 | 328 | 123 | 46 | 364 | .555 | 15 | 21 | 913 | 957 | -44 | 19.1 | 78.7 | 31.52 | 8.8 | 30.38 | .904 |
| 10 |  | Penguins | 189 | 328 | 102 | 37 | 415 | .633 | 12 | 14 | 1,060 | 914 | 146 | 23.0 | 81.0 | 33.60 | 9.6 | 31.67 | .912 |
| 11 |  | Blues | 184 | 328 | 113 | 31 | 399 | .608 | 13 | 9 | 919 | 855 | 64 | 19.8 | 82.9 | 30.75 | 9.1 | 29.11 | .910 |
| 12 |  | Sabres | 126 | 328 | 157 | 45 | 297 | .453 | 10 | 18 | 817 | 992 | -175 | 20.4 | 79.7 | 30.98 | 8.0 | 32.65 | .907 |
| 13 |  | Canucks | 127 | 328 | 157 | 44 | 298 | .454 | 15 | 17 | 801 | 987 | -186 | 17.3 | 79.3 | 28.91 | 8.4 | 32.05 | .906 |
| 14 |  | Flames | 167 | 328 | 133 | 28 | 362 | .552 | 8 | 14 | 956 | 942 | 14 | 18.1 | 79.8 | 31.10 | 9.4 | 29.23 | .902 |
| 15 |  | Islanders | 169 | 328 | 120 | 39 | 377 | .575 | 15 | 17 | 950 | 933 | 17 | 17.9 | 79.8 | 29.95 | 9.7 | 32.20 | .912 |
| 16 |  | Devils | 141 | 328 | 146 | 41 | 323 | .492 | 13 | 17 | 824 | 954 | -130 | 19.2 | 82.1 | 28.56 | 8.8 | 30.88 | .906 |
| 17 |  | Capitals | 208 | 328 | 89 | 31 | 447 | .681 | 13 | 9 | 1,039 | 854 | 185 | 22.1 | 82.1 | 30.11 | 10.5 | 29.91 | .913 |
| 18 |  | Oilers | 149 | 328 | 147 | 32 | 330 | .503 | 16 | 12 | 900 | 982 | -82 | 19.4 | 78.3 | 30.69 | 8.9 | 31.09 | .904 |
| 19 |  | Hurricanes | 153 | 328 | 126 | 49 | 355 | .541 | 10 | 16 | 876 | 925 | -49 | 17.7 | 81.9 | 32.15 | 8.3 | 28.33 | .900 |
| 20 |  | Avalanche | 142 | 328 | 155 | 31 | 315 | .480 | 9 | 5 | 890 | 996 | -106 | 19.0 | 79.7 | 29.75 | 9.1 | 32.32 | .906 |
| 21 |  | Coyotes | 133 | 328 | 157 | 38 | 304 | .463 | 13 | 11 | 814 | 973 | -159 | 16.8 | 79.5 | 29.02 | 8.6 | 32.03 | .907 |
| 22 |  | Sharks | 183 | 328 | 113 | 32 | 398 | .607 | 11 | 10 | 992 | 891 | 101 | 20.9 | 81.7 | 31.57 | 9.6 | 28.43 | .904 |
| 23 |  | Senators | 139 | 328 | 153 | 36 | 314 | .479 | 14 | 18 | 897 | 1,036 | -139 | 17.4 | 77.7 | 29.67 | 9.2 | 32.92 | .904 |
| 24 |  | Lightning | 204 | 328 | 100 | 24 | 432 | .659 | 19 | 9 | 1,063 | 877 | 186 | 22.6 | 81.6 | 30.96 | 10.5 | 31.02 | .914 |
| 25 |  | Ducks | 171 | 328 | 110 | 47 | 389 | .593 | 13 | 17 | 862 | 842 | 20 | 19.3 | 83.8 | 29.43 | 8.9 | 30.88 | .917 |
More NHL News
Connor McDavid has a goal and an assist to lead the Oilers past the Rangers, 4-1

Travis Konecny scores in return as Flyers beat Utah Mammoth 6-3

2 early goals lift Minnesota to a 5-1 win over Washington, snapping the Capitals' 3-game run

Kraken trade one-time top prospect Shane Wright to the Predators for Matthew Wood
Kochetkov makes 26 saves, Walker scores twice as Hurricanes beat Jets 7-0
Artturi Lehkonen and Cale Makar lead the Avalanche to a 5-2 victory over the Flames

More Canadiens Stats
Team Leaders 

G
8
Caufield
A
10
Hutson
+/-
+8
Hutson
Team Rankings
G/GP
3.29
13th
GA/GP
3.00
11th
PP%
9.5
32nd
PK%
81.8
11th
 Bruins
 Canadiens
 Senators
 Maple Leafs
 Lightning
 Panthers
 Sabres
 Red Wings
 WPG
 UTA
 MIN


NHL 2026-27 Leaders











NHL 2026-27 Rankings


NHL 2026-27 Betting


NHL 2026-27 Standings
| Atlantic Division | W | L | OTL | PTS | DIFF |
|---|---|---|---|---|---|
10 | 4 | 1 | 21 | 19 | |
9 | 3 | 2 | 20 | 6 | |
9 | 5 | 1 | 19 | 4 | |
8 | 3 | 2 | 18 | 5 | |
8 | 4 | 2 | 18 | 5 | |
8 | 6 | 2 | 18 | 7 | |
7 | 4 | 3 | 17 | -6 | |
6 | 5 | 3 | 15 | -2 | |
| Metropolitan Division | W | L | OTL | PTS | DIFF |
12 | 2 | 2 | 26 | 27 | |
9 | 5 | 0 | 18 | 8 | |
8 | 5 | 0 | 16 | 2 | |
7 | 5 | 2 | 16 | 1 | |
7 | 7 | 1 | 15 | -1 | |
5 | 7 | 2 | 12 | -2 | |
4 | 8 | 4 | 12 | -19 | |
5 | 7 | 0 | 10 | -10 |
 Hurricanes
 Devils
 Capitals
 Islanders
 Rangers
 Penguins
 Flyers
 Blue Jackets
| Central Division | W | L | OTL | PTS | DIFF |
|---|---|---|---|---|---|
10 | 3 | 3 | 23 | 16 | |
9 | 6 | 0 | 18 | 2 | |
8 | 5 | 1 | 17 | 15 | |
8 | 5 | 1 | 17 | 7 | |
7 | 6 | 1 | 15 | 2 | |
5 | 4 | 5 | 15 | -5 | |
4 | 8 | 3 | 11 | -20 | |
4 | 9 | 1 | 9 | -22 | |
| Pacific Division | W | L | OTL | PTS | DIFF |
11 | 2 | 2 | 24 | 20 | |
9 | 5 | 1 | 19 | 9 | |
8 | 5 | 1 | 17 | 0 | |
7 | 7 | 1 | 15 | -11 | |
6 | 8 | 0 | 12 | -16 | |
5 | 7 | 1 | 11 | -7 | |
4 | 7 | 2 | 10 | -9 | |
3 | 12 | 1 | 7 | -25 |
 Avalanche
 Stars
 Blues
 Predators
 Blackhawks
 Oilers
 Golden Knights
 Kraken
 Sharks
 Flames
 Ducks
 Kings
 Canucks