

 SJS
SJS WSH
WSH1st 08:20
0 - 0
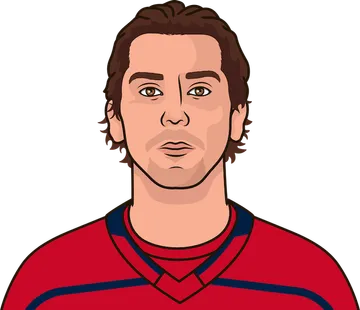
L. Kunin
Goal
Assists:
T. Emberson
M. Ferraro
3rd 17:42
0 - 0
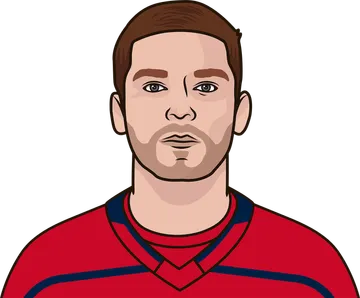
D. Strome
Goal
Assists:
N. Jensen
H. Haman Aktell
3rd 04:45
0 - 0
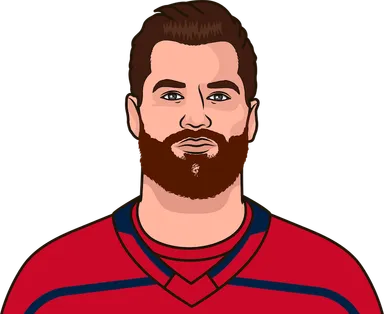
T. Wilson
Goal
Assists:
A. Ovechkin
J. Carlson

3rd 00:58
0 - 0
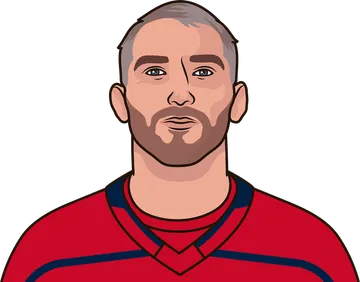
E. Kuznetsov
Goal
Assists:
A. Ovechkin
J. Carlson
Stars of the Game
T. Wilson
1 Goal
7 Shots
D. Kuemper
30 Saves
.968 SV%

M. Blackwood
39 Saves
.951 SV%


31
Shots
42
47.5
Faceoff Pct
52.5
Power Play Pct
0.0
0
Power Play Opps
3
6
Penalty Minutes
0
23
Hits
27
24
Blocked Shots
20
7
Takeaways
9
10
Giveaways
10
0
Biggest Lead
0
2023-24 Pacific Division
SJSWSH
| Team | W | L | OTL | PTS | DIFF |
|---|---|---|---|---|---|
55 | 23 | 4 | 114 | 53 | |
52 | 23 | 7 | 111 | 63 | |
39 | 27 | 16 | 94 | -17 | |
40 | 31 | 11 | 91 | -37 | |
38 | 32 | 12 | 88 | 4 | |
38 | 33 | 11 | 87 | -26 | |
38 | 39 | 5 | 81 | -19 | |
27 | 43 | 12 | 66 | -63 |
Game Info
October 29, 2023
Capital One Arena
Washington, DC
Referees Pierre Lambert, Wes McCauley
Linesmen Jesse Marquis, Bevan Mills
| Forwards | G | A | P | +/- | PIM | PPG | PPA | SHG | SHA | S | S% | FOW | FO | FOW% | HIT | BKS | TKA | GVA | TOI |
|---|---|---|---|---|---|---|---|---|---|---|---|---|---|---|---|---|---|---|---|
L. Kunin #11 | 1 | 0 | 1 | 0 | 0 | 0 | 0 | 0 | 0 | 3 | 33.3 | 1 | 3 | 33.3 | 3 | 2 | 0 | 0 | 17:42 |
R. Carpenter #22 | 0 | 0 | 0 | 0 | 0 | 0 | 0 | 0 | 0 | 4 | 0.0 | 4 | 9 | 44.4 | 1 | 1 | 1 | 0 | 13:06 |
A. Duclair #11 | 0 | 0 | 0 | -2 | 0 | 0 | 0 | 0 | 0 | 0 | 0.0 | 1 | 2 | 50.0 | 2 | 2 | 0 | 0 | 17:14 |
W. Eklund #72 | 0 | 0 | 0 | -1 | 0 | 0 | 0 | 0 | 0 | 2 | 0.0 | 0 | 0 | 0.0 | 2 | 1 | 2 | 1 | 16:57 |
M. Granlund #64 | 0 | 0 | 0 | +1 | 0 | 0 | 0 | 0 | 0 | 2 | 0.0 | 10 | 14 | 71.4 | 2 | 1 | 1 | 1 | 17:47 |
T. Hertl #48 | 0 | 0 | 0 | -2 | 0 | 0 | 0 | 0 | 0 | 2 | 0.0 | 9 | 19 | 47.4 | 2 | 0 | 0 | 1 | 20:06 |
M. Hoffman #68 | 0 | 0 | 0 | -1 | 0 | 0 | 0 | 0 | 0 | 1 | 0.0 | 0 | 1 | 0.0 | 1 | 1 | 0 | 1 | 10:05 |
K. Labanc #62 | 0 | 0 | 0 | 0 | 0 | 0 | 0 | 0 | 0 | 2 | 0.0 | 0 | 1 | 0.0 | 1 | 0 | 0 | 0 | 12:18 |
G. Smith #48 | 0 | 0 | 0 | 0 | 0 | 0 | 0 | 0 | 0 | 2 | 0.0 | 0 | 0 | 0.0 | 0 | 0 | 0 | 0 | 7:43 |
N. Sturm #78 | 0 | 0 | 0 | -1 | 0 | 0 | 0 | 0 | 0 | 0 | 0.0 | 4 | 12 | 33.3 | 1 | 0 | 0 | 0 | 15:07 |
F. Zadina #11 | 0 | 0 | 0 | 0 | 0 | 0 | 0 | 0 | 0 | 0 | 0.0 | 0 | 0 | 0.0 | 0 | 1 | 1 | 3 | 13:01 |
F. Zetterlund #20 | 0 | 0 | 0 | -2 | 2 | 0 | 0 | 0 | 0 | 1 | 0.0 | 0 | 0 | 0.0 | 1 | 0 | 0 | 0 | 15:34 |
| Defensemen | G | A | P | +/- | PIM | PPG | PPA | SHG | SHA | HIT | BKS | TKA | GVA | S | S% | TOI |
|---|---|---|---|---|---|---|---|---|---|---|---|---|---|---|---|---|
T. Emberson #49 | 0 | 1 | 1 | +1 | 0 | 0 | 0 | 0 | 0 | 1 | 4 | 0 | 1 | 0 | 0.0 | 21:15 |
M. Ferraro #38 | 0 | 1 | 1 | +1 | 4 | 0 | 0 | 0 | 0 | 0 | 2 | 0 | 0 | 4 | 0.0 | 21:02 |
M. Benning #83 | 0 | 0 | 0 | -1 | 0 | 0 | 0 | 0 | 0 | 0 | 2 | 0 | 1 | 1 | 0.0 | 16:45 |
K. Burroughs #44 | 0 | 0 | 0 | -2 | 0 | 0 | 0 | 0 | 0 | 6 | 2 | 1 | 0 | 4 | 0.0 | 18:46 |
J. Rutta #44 | 0 | 0 | 0 | -1 | 0 | 0 | 0 | 0 | 0 | 0 | 1 | 0 | 0 | 1 | 0.0 | 19:04 |
M. Vlasic | 0 | 0 | 0 | -1 | 0 | 0 | 0 | 0 | 0 | 0 | 4 | 1 | 0 | 2 | 0.0 | 20:58 |
| Goalies | SA | SV | SV% | GA | GAA | SHO | MIN |
|---|---|---|---|---|---|---|---|
M. Blackwood #39 | 41 | 39 | .951 | 2 | 2.02 | 0 | 60 |
| Forwards | G | A | P | +/- | PIM | PPG | PPA | SHG | SHA | S | S% | FOW | FO | FOW% | HIT | BKS | TKA | GVA | TOI |
|---|---|---|---|---|---|---|---|---|---|---|---|---|---|---|---|---|---|---|---|
A. Ovechkin #8 | 0 | 2 | 2 | +2 | 0 | 0 | 0 | 0 | 0 | 7 | 0.0 | 0 | 0 | 0.0 | 2 | 0 | 0 | 0 | 22:20 |
E. Kuznetsov #92 | 1 | 0 | 1 | 0 | 0 | 0 | 0 | 0 | 0 | 4 | 25.0 | 6 | 17 | 35.3 | 0 | 0 | 0 | 3 | 25:05 |
D. Strome #17 | 1 | 0 | 1 | +2 | 0 | 0 | 0 | 0 | 0 | 1 | 100.0 | 21 | 27 | 77.8 | 0 | 0 | 0 | 1 | 21:00 |
T. Wilson #43 | 1 | 0 | 1 | +2 | 0 | 0 | 0 | 0 | 0 | 7 | 14.3 | 0 | 0 | 0.0 | 5 | 1 | 2 | 1 | 17:16 |
N. Backstrom #19 | 0 | 0 | 0 | 0 | 0 | 0 | 0 | 0 | 0 | 0 | 0.0 | 5 | 10 | 50.0 | 1 | 0 | 1 | 0 | 12:24 |
H. Lapierre #29 | 0 | 0 | 0 | 0 | 0 | 0 | 0 | 0 | 0 | 0 | 0.0 | 0 | 7 | 0.0 | 1 | 0 | 0 | 0 | 7:28 |
B. Malenstyn #29 | 0 | 0 | 0 | 0 | 0 | 0 | 0 | 0 | 0 | 1 | 0.0 | 0 | 0 | 0.0 | 5 | 2 | 0 | 0 | 7:19 |
A. Mantha #39 | 0 | 0 | 0 | 0 | 0 | 0 | 0 | 0 | 0 | 4 | 0.0 | 0 | 0 | 0.0 | 1 | 0 | 1 | 0 | 14:34 |
C. McMichael #24 | 0 | 0 | 0 | 0 | 0 | 0 | 0 | 0 | 0 | 1 | 0.0 | 0 | 0 | 0.0 | 3 | 0 | 1 | 0 | 15:21 |
T.J. Oshie #77 | 0 | 0 | 0 | 0 | 0 | 0 | 0 | 0 | 0 | 3 | 0.0 | 0 | 0 | 0.0 | 2 | 2 | 1 | 2 | 23:04 |
M. Phillips #45 | 0 | 0 | 0 | 0 | 0 | 0 | 0 | 0 | 0 | 0 | 0.0 | 0 | 0 | 0.0 | 0 | 1 | 1 | 0 | 12:26 |
A. Protas #21 | 0 | 0 | 0 | 0 | 0 | 0 | 0 | 0 | 0 | 2 | 0.0 | 0 | 0 | 0.0 | 0 | 1 | 1 | 0 | 7:30 |
| Defensemen | G | A | P | +/- | PIM | PPG | PPA | SHG | SHA | HIT | BKS | TKA | GVA | S | S% | TOI |
|---|---|---|---|---|---|---|---|---|---|---|---|---|---|---|---|---|
J. Carlson #74 | 0 | 2 | 2 | +2 | 0 | 0 | 0 | 0 | 0 | 2 | 2 | 1 | 2 | 2 | 0.0 | 26:45 |
H. Haman Aktell #4 | 0 | 1 | 1 | +1 | 0 | 0 | 0 | 0 | 0 | 2 | 0 | 0 | 0 | 3 | 0.0 | 12:43 |
N. Jensen #3 | 0 | 1 | 1 | +1 | 0 | 0 | 0 | 0 | 0 | 0 | 0 | 0 | 0 | 2 | 0.0 | 15:39 |
M. Fehervary #42 | 0 | 0 | 0 | +1 | 0 | 0 | 0 | 0 | 0 | 1 | 0 | 0 | 0 | 1 | 0.0 | 16:48 |
T. van Riemsdyk #57 | 0 | 0 | 0 | -1 | 0 | 0 | 0 | 0 | 0 | 0 | 6 | 0 | 0 | 1 | 0.0 | 18:09 |
R. Sandin #38 | 0 | 0 | 0 | 0 | 0 | 0 | 0 | 0 | 0 | 2 | 5 | 0 | 0 | 3 | 0.0 | 24:17 |
| Goalies | SA | SV | SV% | GA | GAA | SHO | MIN |
|---|---|---|---|---|---|---|---|
D. Kuemper #35 | 31 | 30 | .968 | 1 | 1.00 | 0 | 60 |
All
1st
2nd
3rd
Evgeny Kuznetsov won faceoff against Tomas Hertl in neutral zone
1st 20:00
Connor McMichael credited with hit on Kyle Burroughs in offensive zone
1st 19:51
Takeaway by Connor McMichael in offensive zone
1st 19:43
Giveaway by Evgeny Kuznetsov in defensive zone
1st 19:35
Shot on goal by Tomas Hertl saved by Darcy Kuemper
1st 19:34
0-0
Giveaway by Evgeny Kuznetsov in offensive zone
1st 19:15
Takeaway by Tom Wilson in neutral zone
1st 19:11
Luke Kunin credited with hit on Trevor van Riemsdyk in offensive zone
1st 19:10
Takeaway by William Eklund in offensive zone
1st 19:01
Hardy Haman Aktell credited with hit on Filip Zadina in defensive zone
1st 18:21
Stoppage - Offside
1st 18:17
Nicklas Backstrom won faceoff against Mike Hoffman in neutral zone
1st 18:17
Nicklas Backstrom credited with hit on Matt Benning in neutral zone
1st 18:04
Shot missed by Nicklas Backstrom
1st 17:39
0-0
Marc-Edouard Vlasic shot blocked by Beck Malenstyn
1st 17:14
0-0
Shot on goal by Kyle Burroughs saved by Darcy Kuemper
1st 17:07
0-0
Beck Malenstyn credited with hit on Marc-Edouard Vlasic in offensive zone
1st 16:55
Shot missed by Kyle Burroughs
1st 16:45
0-0
Tomas Hertl credited with hit on Beck Malenstyn in defensive zone
1st 16:31
Takeaway by T.J. Oshie in defensive zone
1st 16:16
Stoppage - Icing
1st 16:12
Evgeny Kuznetsov won faceoff against Anthony Duclair in defensive zone
1st 16:12
Stoppage - Offside
1st 15:53
Mikael Granlund won faceoff against Dylan Strome in neutral zone
1st 15:53
Shot on goal by Tom Wilson saved by Mackenzie Blackwood
1st 15:31
0-0
Stoppage - Goalie Stopped (after SOG)
1st 15:28
Dylan Strome won faceoff against Mikael Granlund in offensive zone
1st 15:28
William Eklund credited with hit on Martin Fehervary in offensive zone
1st 15:16
Shot missed by Marc-Edouard Vlasic
1st 15:14
0-0
Luke Kunin credited with hit on John Carlson in offensive zone
1st 15:05
Shot on goal by Kyle Burroughs saved by Darcy Kuemper
1st 15:01
0-0
Giveaway by Mike Hoffman in defensive zone
1st 14:42
Shot on goal by Anthony Mantha saved by Mackenzie Blackwood
1st 14:23
0-0
Giveaway by Filip Zadina in neutral zone
1st 13:52
Shot on goal by Matt Benning saved by Darcy Kuemper
1st 13:18
0-0
Rasmus Sandin credited with hit on Ryan Carpenter in defensive zone
1st 13:13
Jan Rutta shot blocked by Beck Malenstyn
1st 13:07
0-0
Beck Malenstyn credited with hit on Kyle Burroughs in offensive zone
1st 12:59
Tomas Hertl credited with hit on Martin Fehervary in offensive zone
1st 12:46
T.J. Oshie shot blocked by Ty Emberson
1st 11:58
0-0
Shot missed by Marc-Edouard Vlasic
1st 11:22
0-0
Stoppage - Goalie Stopped (after SOG) - TV timeout
1st 11:20
Nicklas Backstrom won faceoff against Nico Sturm in defensive zone
1st 11:20
Giveaway by Mackenzie Blackwood in defensive zone
1st 10:47
Kyle Burroughs credited with hit on Anthony Mantha in offensive zone
1st 10:35
Shot on goal by Marc-Edouard Vlasic saved by Darcy Kuemper
1st 09:59
0-0
Marc-Edouard Vlasic shot blocked by Aliaksei Protas
1st 09:55
0-0
Kevin Labanc credited with hit on Beck Malenstyn in neutral zone
1st 09:48
Shot on goal by Kevin Labanc saved by Darcy Kuemper
1st 09:39
0-0
Stoppage - Goalie Stopped (after SOG) - TV timeout
1st 09:36
Evgeny Kuznetsov won faceoff against Tomas Hertl in defensive zone
1st 09:36
Giveaway by T.J. Oshie in defensive zone
1st 09:28
Shot missed by Fabian Zetterlund
1st 09:25
0-0
Giveaway by William Eklund in offensive zone
1st 08:34
Giveaway by Evgeny Kuznetsov in defensive zone
1st 08:26
Shot missed by Luke Kunin
1st 08:23
0-0
Goal scored by Luke Kunin assisted by Ty Emberson and Mario Ferraro
1st 08:20
0-0
Nico Sturm won faceoff against Nicklas Backstrom in neutral zone
1st 08:20
Stoppage - Icing
1st 07:46
Dylan Strome won faceoff against Nico Sturm in offensive zone
1st 07:46
Tom Wilson credited with hit on Jan Rutta in offensive zone
1st 07:28
Shot on goal by Ryan Carpenter saved by Darcy Kuemper
1st 07:23
0-0
Martin Fehervary credited with hit on Ryan Carpenter in defensive zone
1st 07:17
Tom Wilson credited with hit on Jan Rutta in defensive zone
1st 07:12
Stoppage - Offside
1st 07:09
Anthony Duclair won faceoff against Evgeny Kuznetsov in neutral zone
1st 07:09
Stoppage - Puck in Crowd
1st 07:04
Tomas Hertl won faceoff against Evgeny Kuznetsov in neutral zone
1st 07:04
Giveaway by Matt Benning in defensive zone
1st 06:42
Connor McMichael credited with hit on Matt Benning in offensive zone
1st 06:41
Tomas Hertl shot blocked by Rasmus Sandin
1st 06:29
0-0
Fabian Zetterlund shot blocked by Rasmus Sandin
1st 06:18
0-0
Ty Emberson credited with hit on Anthony Mantha in neutral zone
1st 05:53
Shot on goal by Hardy Haman Aktell saved by Mackenzie Blackwood
1st 05:39
0-0
Stoppage - Goalie Stopped (after SOG) - TV timeout
1st 05:38
Dylan Strome won faceoff against Nico Sturm in offensive zone
1st 05:38
Shot missed by Alex Ovechkin
1st 05:37
0-0
Mike Hoffman credited with hit on Hardy Haman Aktell in defensive zone
1st 05:31
Penalty to Mario Ferraro 2 minutes for High Sticking (Drawn by Dylan Strome)
1st 05:21
Power play - Dylan Strome won faceoff against Luke Kunin in offensive zone
1st 05:21
Power play - Shot on goal by Evgeny Kuznetsov saved by Mackenzie Blackwood
1st 05:18
0-0
Power play - Shot missed by Alex Ovechkin
1st 04:32
0-0
Power play - Shot on goal by T.J. Oshie saved by Mackenzie Blackwood
1st 04:08
0-0
Power play - John Carlson credited with hit on Matt Benning in offensive zone
1st 04:04
Power play - Shot on goal by John Carlson saved by Mackenzie Blackwood
1st 03:56
0-0
Power play - Shot missed by John Carlson
1st 03:55
0-0
Power play - Alex Ovechkin shot blocked by Marc-Edouard Vlasic
1st 03:40
0-0
Stoppage - Puck Frozen
1st 03:38
Shorthanded - Tomas Hertl won faceoff against Nicklas Backstrom in defensive zone
1st 03:38
Shot on goal by Kyle Burroughs saved by Darcy Kuemper
1st 02:57
0-0
Takeaway by Anthony Mantha in neutral zone
1st 02:42
Giveaway by Filip Zadina in defensive zone
1st 02:19
Nick Jensen shot blocked by Filip Zadina
1st 02:18
0-0
Shot on goal by Aliaksei Protas saved by Mackenzie Blackwood
1st 02:16
0-0
Stoppage - Goalie Stopped (after SOG)
1st 02:14
Nico Sturm won faceoff against Dylan Strome in defensive zone
1st 02:14
Stoppage - Icing
1st 01:55
Dylan Strome won faceoff against Nico Sturm in defensive zone
1st 01:55
Shot on goal by Mike Hoffman saved by Darcy Kuemper
1st 01:29
0-0
Shot missed by T.J. Oshie
1st 01:15
0-0
Evgeny Kuznetsov shot blocked by Ty Emberson
1st 01:07
0-0
Giveaway by T.J. Oshie in offensive zone
1st 01:03
Stoppage - Icing
1st 00:59
Mikael Granlund won faceoff against Evgeny Kuznetsov in defensive zone
1st 00:59
Stoppage - Puck Frozen
1st 00:55
Evgeny Kuznetsov won faceoff against Mikael Granlund in offensive zone
1st 00:55
Shot on goal by T.J. Oshie saved by Mackenzie Blackwood
1st 00:54
0-0
Stoppage - Goalie Stopped (after SOG)
1st 00:53
Evgeny Kuznetsov won faceoff against Tomas Hertl in offensive zone
1st 00:53
Rasmus Sandin shot blocked by Mario Ferraro
1st 00:50
0-0
Fabian Zetterlund shot blocked by John Carlson
1st 00:39
0-0
Stoppage - Puck in Crowd
1st 00:30
Dylan Strome won faceoff against Nico Sturm in offensive zone
1st 00:30
Shot on goal by Alex Ovechkin saved by Mackenzie Blackwood
1st 00:29
0-0
Stoppage - Goalie Stopped (after SOG)
1st 00:27
Dylan Strome won faceoff against Nico Sturm in offensive zone
1st 00:27
Shot on goal by Tom Wilson saved by Mackenzie Blackwood
1st 00:26
0-0
Shot on goal by Tom Wilson saved by Mackenzie Blackwood
1st 00:25
0-0
Stoppage - Goalie Stopped (after SOG)
1st 00:24
Dylan Strome won faceoff against Nico Sturm in offensive zone
1st 00:24
Shot on goal by Alex Ovechkin saved by Mackenzie Blackwood
1st 00:23
0-0
Shot missed by Tom Wilson
1st 00:22
0-0
John Carlson shot blocked by Luke Kunin
1st 00:16
0-0
John Carlson shot blocked by Kyle Burroughs
1st 00:14
0-0
End of 1st
1st
Tomas Hertl won faceoff against Evgeny Kuznetsov in neutral zone
2nd 20:00
Connor McMichael credited with hit on Kyle Burroughs in neutral zone
2nd 19:56
Takeaway by Kyle Burroughs in defensive zone
2nd 19:39
Stoppage - Player Injury
2nd 19:25
Mikael Granlund won faceoff against Dylan Strome in neutral zone
2nd 19:25
William Eklund credited with hit on Tom Wilson in neutral zone
2nd 18:41
Hardy Haman Aktell credited with hit on Luke Kunin in offensive zone
2nd 18:41
Tom Wilson credited with hit on William Eklund in neutral zone
2nd 18:41
Giveaway by Filip Zadina in neutral zone
2nd 18:22
Shot on goal by Anthony Mantha saved by Mackenzie Blackwood
2nd 18:20
0-0
Penalty to Mario Ferraro 2 minutes for Slashing (Drawn by Anthony Mantha)
2nd 18:17
Power play - Dylan Strome won faceoff against Ryan Carpenter in offensive zone
2nd 18:17
Power play - John Carlson shot blocked by Marc-Edouard Vlasic
2nd 18:13
0-0
Power play - T.J. Oshie shot blocked by Marc-Edouard Vlasic
2nd 17:54
0-0
Power play - Alex Ovechkin credited with hit on Tomas Hertl in defensive zone
2nd 17:27
Shorthanded - Shot on goal by Kyle Burroughs saved by Darcy Kuemper
2nd 17:24
0-0
Shorthanded - Takeaway by Ryan Carpenter in neutral zone
2nd 17:10
Shorthanded - Shot missed by Nico Sturm
2nd 17:07
0-0
Shorthanded - Shot on goal by Luke Kunin saved by Darcy Kuemper
2nd 16:39
0-0
Stoppage - Goalie Stopped (after SOG)
2nd 16:37
Shorthanded - Mikael Granlund won faceoff against Nicklas Backstrom in offensive zone
2nd 16:37
Anthony Duclair credited with hit on Matthew Phillips in offensive zone
2nd 16:16
Nick Jensen shot blocked by Anthony Duclair
2nd 16:01
0-0
Shot on goal by Kevin Labanc saved by Darcy Kuemper
2nd 15:38
0-0
Stoppage - Goalie Stopped (after SOG)
2nd 15:37
Ryan Carpenter won faceoff against Hendrix Lapierre in offensive zone
2nd 15:37
Shot missed by Jan Rutta
2nd 15:35
0-0
Shot on goal by Givani Smith saved by Darcy Kuemper
2nd 15:32
0-0
Takeaway by Aliaksei Protas in offensive zone
2nd 15:12
Beck Malenstyn credited with hit on Kyle Burroughs in offensive zone
2nd 15:06
Beck Malenstyn credited with hit on Kevin Labanc in neutral zone
2nd 14:55
Shot missed by Anthony Duclair
2nd 14:10
0-0
Marc-Edouard Vlasic shot blocked by T.J. Oshie
2nd 14:03
0-0
John Carlson credited with hit on Luke Kunin in defensive zone
2nd 13:27
Stoppage - Puck in Benches - TV timeout
2nd 13:20
Dylan Strome won faceoff against Ryan Carpenter in offensive zone
2nd 13:20
Takeaway by Tom Wilson in offensive zone
2nd 13:13
Takeaway by Marc-Edouard Vlasic in defensive zone
2nd 13:10
Shot on goal by Tom Wilson saved by Mackenzie Blackwood
2nd 13:08
0-0
Stoppage - Goalie Stopped (after SOG)
2nd 13:06
Dylan Strome won faceoff against Ryan Carpenter in offensive zone
2nd 13:06
Shot on goal by Rasmus Sandin saved by Mackenzie Blackwood
2nd 13:04
0-0
Tom Wilson credited with hit on Nico Sturm in offensive zone
2nd 13:00
Rasmus Sandin credited with hit on Ryan Carpenter in defensive zone
2nd 12:47
Tom Wilson credited with hit on Matt Benning in offensive zone
2nd 12:33
Shot on goal by Ryan Carpenter saved by Darcy Kuemper
2nd 12:19
0-0
Takeaway by Filip Zadina in defensive zone
2nd 12:01
Fabian Zetterlund shot blocked by Trevor van Riemsdyk
2nd 11:00
0-0
Shot on goal by Tomas Hertl saved by Darcy Kuemper
2nd 10:57
0-0
Stoppage - Icing
2nd 10:43
Mikael Granlund won faceoff against Evgeny Kuznetsov in offensive zone
2nd 10:43
Shot on goal by Mario Ferraro saved by Darcy Kuemper
2nd 10:41
0-0
Takeaway by Matthew Phillips in offensive zone
2nd 10:22
Takeaway by William Eklund in offensive zone
2nd 09:53
Shot on goal by Mikael Granlund saved by Darcy Kuemper
2nd 09:51
0-0
Stoppage - Goalie Stopped (after SOG) - TV timeout
2nd 09:49
Nico Sturm won faceoff against Hendrix Lapierre in offensive zone
2nd 09:49
Nick Jensen shot blocked by Mike Hoffman
2nd 09:26
0-0
Stoppage - Puck Frozen
2nd 09:03
Dylan Strome won faceoff against Ryan Carpenter in offensive zone
2nd 09:03
Ryan Carpenter credited with hit on John Carlson in offensive zone
2nd 08:49
Giveaway by Tom Wilson in neutral zone
2nd 08:13
Alex Ovechkin credited with hit on Kyle Burroughs in offensive zone
2nd 08:12
Stoppage - Icing
2nd 08:08
Evgeny Kuznetsov won faceoff against Tomas Hertl in offensive zone
2nd 08:08
Shot missed by Trevor van Riemsdyk
2nd 08:04
0-0
Anthony Duclair credited with hit on Connor McMichael in defensive zone
2nd 07:42
Martin Fehervary shot blocked by Ty Emberson
2nd 07:32
0-0
T.J. Oshie shot blocked by Anthony Duclair
2nd 07:24
0-0
Evgeny Kuznetsov shot blocked by Mario Ferraro
2nd 07:17
0-0
Luke Kunin credited with hit on Matthew Phillips in defensive zone
2nd 06:37
Shot on goal by Nick Jensen saved by Mackenzie Blackwood
2nd 06:31
0-0
Stoppage - Goalie Stopped (after SOG)
2nd 06:29
Dylan Strome won faceoff against Nico Sturm in offensive zone
2nd 06:29
Shot missed by Tom Wilson
2nd 06:19
0-0
Shot missed by John Carlson
2nd 05:50
0-0
Shot on goal by Givani Smith saved by Darcy Kuemper
2nd 05:04
0-0
Shot on goal by Ryan Carpenter saved by Darcy Kuemper
2nd 05:03
0-0
Kyle Burroughs credited with hit on Connor McMichael in defensive zone
2nd 04:42
Penalty to Fabian Zetterlund 2 minutes for Holding (Drawn by T.J. Oshie)
2nd 04:24
Stoppage - TV timeout
2nd 04:24
Shorthanded - Luke Kunin won faceoff against Dylan Strome in defensive zone
2nd 04:24
Shorthanded - Shot on goal by Mario Ferraro saved by Darcy Kuemper
2nd 04:22
0-0
Shorthanded - Luke Kunin shot blocked by John Carlson
2nd 03:54
0-0
Stoppage - Puck in Netting
2nd 03:51
Power play - Dylan Strome won faceoff against Tomas Hertl in defensive zone
2nd 03:51
Power play - Shot on goal by Alex Ovechkin saved by Mackenzie Blackwood
2nd 03:21
0-0
Power play - Shot on goal by Alex Ovechkin saved by Mackenzie Blackwood
2nd 03:01
0-0
Power play - Shot on goal by Alex Ovechkin saved by Mackenzie Blackwood
2nd 03:00
0-0
Stoppage - Goalie Stopped (after SOG)
2nd 02:59
Power play - Dylan Strome won faceoff against Luke Kunin in offensive zone
2nd 02:59
Power play - John Carlson shot blocked by Matt Benning
2nd 02:57
0-0
Power play - John Carlson shot blocked by Luke Kunin
2nd 02:52
0-0
Power play - Evgeny Kuznetsov shot blocked by Matt Benning
2nd 02:36
0-0
Shot on goal by Alex Ovechkin saved by Mackenzie Blackwood
2nd 02:20
0-0
Stoppage - Goalie Stopped (after SOG)
2nd 02:16
Nicklas Backstrom won faceoff against Mikael Granlund in offensive zone
2nd 02:16
Shot on goal by Rasmus Sandin saved by Mackenzie Blackwood
2nd 02:11
0-0
Stoppage - Goalie Stopped (after SOG)
2nd 02:10
Nicklas Backstrom won faceoff against Mikael Granlund in offensive zone
2nd 02:10
Shot on goal by Rasmus Sandin saved by Mackenzie Blackwood
2nd 02:06
0-0
Shot on goal by Connor McMichael saved by Mackenzie Blackwood
2nd 02:04
0-0
Kyle Burroughs credited with hit on Matthew Phillips in defensive zone
2nd 01:52
Stoppage - Puck in Crowd
2nd 01:35
Tomas Hertl won faceoff against Hendrix Lapierre in offensive zone
2nd 01:35
Shot on goal by Anthony Mantha saved by Mackenzie Blackwood
2nd 01:22
0-0
Stoppage - Goalie Stopped (after SOG)
2nd 01:20
Tomas Hertl won faceoff against Hendrix Lapierre in defensive zone
2nd 01:20
Stoppage - Icing
2nd 01:13
Tomas Hertl won faceoff against Dylan Strome in defensive zone
2nd 01:13
Shot on goal by Nick Jensen saved by Mackenzie Blackwood
2nd 00:53
0-0
Stoppage - Goalie Stopped (after SOG)
2nd 00:51
Dylan Strome won faceoff against Ryan Carpenter in offensive zone
2nd 00:51
Dylan Strome shot blocked by Marc-Edouard Vlasic
2nd 00:21
0-0
Giveaway by Dylan Strome in offensive zone
2nd 00:05
End of 2nd
2nd
Tomas Hertl won faceoff against Evgeny Kuznetsov in neutral zone
3rd 20:00
Shot on goal by T.J. Oshie saved by Mackenzie Blackwood
3rd 19:58
0-0
Stoppage - Goalie Stopped (after SOG)
3rd 19:55
Tomas Hertl won faceoff against Evgeny Kuznetsov in defensive zone
3rd 19:55
Kyle Burroughs credited with hit on Connor McMichael in defensive zone
3rd 19:23
Giveaway by John Carlson in defensive zone
3rd 19:18
Tom Wilson shot blocked by Ty Emberson
3rd 19:02
0-0
Shot on goal by Mikael Granlund saved by Darcy Kuemper
3rd 18:55
0-0
Stoppage - Goalie Stopped (after SOG)
3rd 18:53
Mikael Granlund won faceoff against Nicklas Backstrom in offensive zone
3rd 18:53
Shot missed by Mario Ferraro
3rd 18:49
0-0
Luke Kunin shot blocked by Rasmus Sandin
3rd 18:43
0-0
Shot on goal by Jan Rutta saved by Darcy Kuemper
3rd 18:17
0-0
Anthony Mantha credited with hit on Matt Benning in offensive zone
3rd 17:59
Nico Sturm credited with hit on Hardy Haman Aktell in defensive zone
3rd 17:48
Shot on goal by Hardy Haman Aktell saved by Mackenzie Blackwood
3rd 17:47
0-0
Goal scored by Dylan Strome assisted by Nick Jensen and Hardy Haman Aktell
3rd 17:42
0-0
Ryan Carpenter won faceoff against Hendrix Lapierre in neutral zone
3rd 17:42
Kyle Burroughs credited with hit on Beck Malenstyn in defensive zone
3rd 17:17
Beck Malenstyn credited with hit on Kyle Burroughs in offensive zone
3rd 17:16
Hendrix Lapierre credited with hit on Mario Ferraro in offensive zone
3rd 16:53
Stoppage - Icing
3rd 16:33
Mikael Granlund won faceoff against Evgeny Kuznetsov in offensive zone
3rd 16:33
Shot on goal by Mario Ferraro saved by Darcy Kuemper
3rd 16:31
0-0
Stoppage - Goalie Stopped (after SOG)
3rd 16:29
Mikael Granlund won faceoff against Evgeny Kuznetsov in offensive zone
3rd 16:29
Takeaway by John Carlson in defensive zone
3rd 16:21
T.J. Oshie credited with hit on Mario Ferraro in offensive zone
3rd 16:14
Giveaway by John Carlson in offensive zone
3rd 16:05
T.J. Oshie credited with hit on Mikael Granlund in neutral zone
3rd 16:05
Stoppage - Puck in Benches
3rd 15:50
Nicklas Backstrom won faceoff against Tomas Hertl in neutral zone
3rd 15:50
Fabian Zetterlund credited with hit on Rasmus Sandin in neutral zone
3rd 15:45
Shot on goal by Fabian Zetterlund saved by Darcy Kuemper
3rd 15:40
0-0
Stoppage - Puck Frozen
3rd 15:35
Tomas Hertl won faceoff against Nicklas Backstrom in offensive zone
3rd 15:35
Jan Rutta shot blocked by Matthew Phillips
3rd 15:34
0-0
Kevin Labanc shot blocked by Tom Wilson
3rd 15:01
0-0
Kyle Burroughs shot blocked by Rasmus Sandin
3rd 14:55
0-0
Stoppage - Puck in Netting
3rd 14:51
Dylan Strome won faceoff against Kevin Labanc in defensive zone
3rd 14:51
Shot on goal by Hardy Haman Aktell saved by Mackenzie Blackwood
3rd 14:21
0-0
Shot on goal by Anthony Mantha saved by Mackenzie Blackwood
3rd 13:37
0-0
Stoppage - Goalie Stopped (after SOG) - TV timeout
3rd 13:35
Mikael Granlund won faceoff against Evgeny Kuznetsov in defensive zone
3rd 13:35
Shot missed by Fabian Zetterlund
3rd 12:47
0-0
Tomas Hertl shot blocked by Trevor van Riemsdyk
3rd 12:22
0-0
Kevin Labanc shot blocked by Trevor van Riemsdyk
3rd 12:00
0-0
Shot missed by Hardy Haman Aktell
3rd 11:31
0-0
Kyle Burroughs credited with hit on Aliaksei Protas in defensive zone
3rd 11:25
Shot on goal by Marc-Edouard Vlasic saved by Darcy Kuemper
3rd 11:12
0-0
Takeaway by Mikael Granlund in defensive zone
3rd 10:50
Mikael Granlund credited with hit on John Carlson in offensive zone
3rd 10:39
Stoppage - Icing
3rd 10:37
Nico Sturm won faceoff against Hendrix Lapierre in offensive zone
3rd 10:37
Anthony Duclair shot blocked by Trevor van Riemsdyk
3rd 09:42
0-0
Giveaway by Darcy Kuemper in defensive zone
3rd 09:39
Tomas Hertl shot blocked by Trevor van Riemsdyk
3rd 09:17
0-0
Shot on goal by William Eklund saved by Darcy Kuemper
3rd 09:11
0-0
Shot on goal by Mario Ferraro saved by Darcy Kuemper
3rd 09:08
0-0
Tomas Hertl shot blocked by T.J. Oshie
3rd 08:54
0-0
Takeaway by Nicklas Backstrom in offensive zone
3rd 08:37
Stoppage - Offside - TV timeout
3rd 07:50
Dylan Strome won faceoff against Tomas Hertl in neutral zone
3rd 07:50
Shot on goal by Tom Wilson saved by Mackenzie Blackwood
3rd 07:41
0-0
Shot on goal by Luke Kunin saved by Darcy Kuemper
3rd 06:35
0-0
Shot on goal by William Eklund saved by Darcy Kuemper
3rd 06:19
0-0
Luke Kunin shot blocked by Trevor van Riemsdyk
3rd 06:12
0-0
Shot on goal by Martin Fehervary saved by Mackenzie Blackwood
3rd 05:40
0-0
Stoppage - Goalie Stopped (after SOG) - TV timeout
3rd 05:38
Dylan Strome won faceoff against Tomas Hertl in offensive zone
3rd 05:38
Shot on goal by Alex Ovechkin saved by Mackenzie Blackwood
3rd 05:36
0-0
Stoppage - Goalie Stopped (after SOG)
3rd 05:32
Dylan Strome won faceoff against Tomas Hertl in offensive zone
3rd 05:32
Shot on goal by John Carlson saved by Mackenzie Blackwood
3rd 05:31
0-0
Stoppage - Icing
3rd 05:18
Dylan Strome won faceoff against Tomas Hertl in offensive zone
3rd 05:18
Shot on goal by Tom Wilson saved by Mackenzie Blackwood
3rd 05:15
0-0
Tom Wilson shot blocked by Kyle Burroughs
3rd 04:57
0-0
Giveaway by Tomas Hertl in defensive zone
3rd 04:54
Alex Ovechkin shot blocked by teammate
3rd 04:49
0-0
Goal scored by Tom Wilson assisted by Alex Ovechkin and John Carlson
3rd 04:45
0-0
Mikael Granlund won faceoff against Evgeny Kuznetsov in neutral zone
3rd 04:45
Shot on goal by Trevor van Riemsdyk saved by Mackenzie Blackwood
3rd 04:27
0-0
Evgeny Kuznetsov shot blocked by William Eklund
3rd 04:19
0-0
Stoppage - Icing
3rd 02:43
Ryan Carpenter won faceoff against Dylan Strome in defensive zone
3rd 02:43
Giveaway by Mikael Granlund in neutral zone
3rd 02:01
Shot on goal by Evgeny Kuznetsov saved by Mackenzie Blackwood
3rd 01:59
0-0
Shot on goal by Evgeny Kuznetsov saved by Mackenzie Blackwood
3rd 01:58
0-0
Shot on goal by Beck Malenstyn saved by Mackenzie Blackwood
3rd 01:55
0-0
Evgeny Kuznetsov shot blocked by Mikael Granlund
3rd 01:48
0-0
Mikael Granlund credited with hit on Beck Malenstyn in neutral zone
3rd 01:14
Goal scored by Evgeny Kuznetsov assisted by Alex Ovechkin and John Carlson (Empty Net)
3rd 00:58
0-0
Ryan Carpenter won faceoff against Hendrix Lapierre in neutral zone
3rd 00:58
Alex Ovechkin shot blocked by Jan Rutta
3rd 00:52
0-0
Giveaway by Ty Emberson in neutral zone
3rd 00:50
Shot on goal by Ryan Carpenter saved by Darcy Kuemper
3rd 00:37
0-0
Ryan Carpenter shot blocked by Rasmus Sandin
3rd 00:28
0-0
Shot on goal by Aliaksei Protas saved by Mackenzie Blackwood
3rd 00:14
0-0
Aliaksei Protas shot blocked by Ryan Carpenter
3rd 00:04
0-0
End of 3rd
3rd