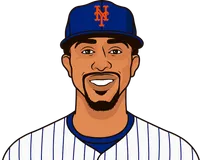
Francisco Lindor was 4-14 in 17 plate appearances in the last 12 team games for the Mets against left-handed pitchers at home.
| NAME | G | AB | H | 2B | 3B | HR | RBI | BB | HBP | SO | PA | TB | XBH | SH | SF | IBB | AVG | OBP | SLG | OPS | ||
|---|---|---|---|---|---|---|---|---|---|---|---|---|---|---|---|---|---|---|---|---|---|---|
| 1 |  | F. Lindor | 10 | 14 | 4 | 1 | 0 | 0 | 0 | 3 | 0 | 2 | 17 | 5 | 1 | 0 | 0 | 0 | .286 | .412 | .357 | .769 |
| 2 |  | J. Soto | 11 | 17 | 3 | 0 | 0 | 0 | 1 | 0 | 0 | 2 | 17 | 3 | 0 | 0 | 0 | 0 | .176 | .176 | .176 | .353 |
| 3 |  | B. Bichette | 9 | 12 | 3 | 0 | 0 | 2 | 3 | 2 | 0 | 3 | 14 | 9 | 2 | 0 | 0 | 0 | .250 | .357 | .750 | 1.107 |
| 4 |  | J. Young | 3 | 3 | 3 | 1 | 0 | 0 | 1 | 0 | 0 | 0 | 3 | 4 | 1 | 0 | 0 | 0 | 1.000 | 1.000 | 1.333 | 2.333 |
| 5 | | C. Benge | 11 | 16 | 5 | 0 | 0 | 0 | 1 | 2 | 1 | 5 | 19 | 5 | 0 | 0 | 0 | 0 | .313 | .421 | .313 | .734 |
| 6 |  | M. Semien | 8 | 10 | 1 | 0 | 0 | 0 | 0 | 2 | 0 | 1 | 12 | 1 | 0 | 0 | 0 | 0 | .100 | .250 | .100 | .350 |
| 7 |  | L. Robert Jr. | 1 | 1 | 0 | 0 | 0 | 0 | 0 | 0 | 0 | 0 | 1 | 0 | 0 | 0 | 0 | 0 | .000 | .000 | .000 | .000 |
| 8 |  | C. Morel | 4 | 5 | 0 | 0 | 0 | 0 | 0 | 0 | 0 | 1 | 5 | 0 | 0 | 0 | 0 | 0 | .000 | .000 | .000 | .000 |
| 9 | | A.J. Ewing | 7 | 10 | 4 | 1 | 0 | 0 | 0 | 0 | 0 | 1 | 10 | 5 | 1 | 0 | 0 | 0 | .400 | .400 | .500 | .900 |
| 10 | | M. Vientos | 5 | 9 | 1 | 0 | 0 | 1 | 3 | 1 | 0 | 3 | 10 | 4 | 1 | 0 | 0 | 0 | .111 | .200 | .444 | .644 |
| 11 | | F. Alvarez | 4 | 8 | 3 | 0 | 0 | 1 | 1 | 0 | 0 | 1 | 8 | 6 | 1 | 0 | 0 | 0 | .375 | .375 | .750 | 1.125 |
| 12 | | N. Morabito | 3 | 4 | 0 | 0 | 0 | 0 | 0 | 1 | 0 | 1 | 5 | 0 | 0 | 0 | 0 | 0 | .000 | .200 | .000 | .200 |
| 13 | | L. Torrens | 3 | 5 | 1 | 0 | 0 | 0 | 0 | 0 | 0 | 1 | 5 | 1 | 0 | 0 | 0 | 0 | .200 | .200 | .200 | .400 |
| 14 | | B. Baty | 3 | 2 | 1 | 0 | 0 | 0 | 1 | 1 | 0 | 0 | 3 | 1 | 0 | 0 | 0 | 0 | .500 | .667 | .500 | 1.167 |
Some of the information used here was obtained free of charge from Retrosheet.
More MLB News
Yandy Díaz’s guarantee the Rays will win Game 6 doesn't rile up the Guardians

MLB qualifying offer price rises to $23.15 million, up 5.1%
Milwaukee's dominant bullpen has the Brewers believing they could win their first World Series title
Athletics hire Taylor Smith as president of baseball operations

Baltimore Orioles hire Jared Banner as general manager to work alongside team president Mike Elias
Yandy Díaz's 3 hits spark Rays in Game 5 win over Guardians, raising postseason average to .314

More Mets Stats
Team Batting Leaders 


HR
27
Soto
RBI
78
Bichette
AVG
.282
Benge
Team Pitching Leaders 
W
12
McLean
K
194
McLean
ERA
3.16
McLean
Team Rankings
HR
204
7th
R
699
20th
SO
1,450
6th
ERA
4.15
17th
 Marlins
 Nationals
 Mets

MLB 2026 Batting Leaders


MLB 2026 Pitching Leaders


MLB Fantasy 2026
MLB 2026 Betting


MLB 2026 Standings
| NL East | W | L | PCT | GB |
|---|---|---|---|---|
 Braves - y | 94 | 68 | .580 | |
 Phillies - w | 88 | 74 | .543 | 6.0 |
80 | 82 | .494 | 14.0 | |
77 | 85 | .475 | 17.0 | |
74 | 88 | .457 | 20.0 | |
| NL Central | W | L | PCT | GB |
 Brewers - y | 103 | 59 | .636 | |
 Cubs - w | 89 | 73 | .549 | 14.0 |
82 | 80 | .506 | 21.0 | |
77 | 85 | .475 | 26.0 | |
75 | 87 | .463 | 28.0 | |
| NL West | W | L | PCT | GB |
 Dodgers - y | 100 | 62 | .617 | |
 Padres - w | 91 | 71 | .562 | 9.0 |
86 | 76 | .531 | 14.0 | |
65 | 97 | .401 | 35.0 | |
58 | 104 | .358 | 42.0 |
 Pirates
 Cardinals
 Reds
 Diamondbacks
 Giants
 Rockies
| AL East | W | L | PCT | GB |
|---|---|---|---|---|
 Rays - y | 98 | 64 | .605 | |
 Yankees - w | 93 | 68 | .578 | 4.5 |
 Red Sox - w | 87 | 75 | .537 | 11.0 |
79 | 82 | .491 | 18.5 | |
79 | 83 | .488 | 19.0 | |
| AL Central | W | L | PCT | GB |
 Guardians - y | 85 | 77 | .525 | |
 White Sox - w | 84 | 78 | .519 | 1.0 |
77 | 85 | .475 | 8.0 | |
76 | 86 | .469 | 9.0 | |
69 | 93 | .426 | 16.0 | |
| AL West | W | L | PCT | GB |
 Astros - y | 81 | 81 | .500 | |
80 | 82 | .494 | 1.0 | |
76 | 86 | .469 | 5.0 | |
64 | 98 | .395 | 17.0 | |
62 | 100 | .383 | 19.0 |
 Orioles
 Blue Jays
 Twins
 Tigers
 Royals
 Rangers
 Mariners
 Athletics
 Angels