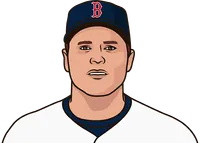
Between May 14, 1982 and April 27, 2008, Roger Clemens fanned the most batters, with 4,672 strikeouts.
Showing
| NAME | SO | G | W | L | W% | GS | ERA | CG | SHO | SV | IP | H | ER | R | HR | BB | HBP | GF | IBB | TBF | WP | K/9 | BB/9 | K/BB | HR/9 | K% | BB% | WHIP | BABIP | RA | H/9 | ||
|---|---|---|---|---|---|---|---|---|---|---|---|---|---|---|---|---|---|---|---|---|---|---|---|---|---|---|---|---|---|---|---|---|---|
| 1 |  | R. Clemens | 4,672 | 709 | 354 | 184 | .658 | 707 | 3.12 | 118 | 46 | 0 | 4916.2 | 4,185 | 1,707 | 1,885 | 363 | 1,580 | 159 | 0 | 63 | 20,240 | 143 | 8.55 | 2.89 | 2.96 | 0.66 | 23.1 | 7.8 | 1.17 | .284 | 3.45 | 7.66 |
| 2 |  | R. Johnson | 4,636 | 569 | 285 | 151 | .654 | 559 | 3.22 | 98 | 37 | 2 | 3872.0 | 3,077 | 1,386 | 1,566 | 369 | 1,431 | 184 | 5 | 29 | 15,951 | 102 | 10.78 | 3.33 | 3.24 | 0.86 | 29.1 | 9.0 | 1.16 | .290 | 3.64 | 7.15 |
| 3 |  | G. Maddux | 3,292 | 716 | 349 | 215 | .619 | 712 | 3.12 | 109 | 35 | 0 | 4846.1 | 4,550 | 1,678 | 1,890 | 336 | 975 | 131 | 3 | 173 | 19,747 | 68 | 6.11 | 1.81 | 3.38 | 0.62 | 16.7 | 4.9 | 1.14 | .281 | 3.51 | 8.45 |
| 4 |  | C. Schilling | 3,116 | 569 | 216 | 146 | .597 | 436 | 3.46 | 83 | 20 | 22 | 3261.0 | 2,998 | 1,253 | 1,318 | 347 | 711 | 52 | 81 | 43 | 13,284 | 72 | 8.60 | 1.96 | 4.38 | 0.96 | 23.5 | 5.4 | 1.14 | .293 | 3.64 | 8.27 |
| 5 |  | P. Martinez | 3,031 | 448 | 209 | 93 | .692 | 381 | 2.81 | 46 | 17 | 3 | 2677.0 | 2,050 | 837 | 922 | 215 | 709 | 132 | 23 | 27 | 10,726 | 60 | 10.19 | 2.38 | 4.28 | 0.72 | 28.3 | 6.6 | 1.03 | .276 | 3.10 | 6.89 |
| 6 |  | J. Smoltz | 3,011 | 707 | 210 | 147 | .588 | 466 | 3.25 | 53 | 16 | 154 | 3394.0 | 2,976 | 1,227 | 1,334 | 277 | 992 | 54 | 204 | 82 | 13,921 | 145 | 7.98 | 2.63 | 3.04 | 0.73 | 21.6 | 7.1 | 1.17 | .282 | 3.54 | 7.89 |
| 7 | | M. Mussina | 2,673 | 508 | 252 | 147 | .632 | 507 | 3.71 | 57 | 23 | 0 | 3389.2 | 3,275 | 1,398 | 1,490 | 366 | 758 | 55 | 0 | 26 | 13,886 | 67 | 7.10 | 2.01 | 3.53 | 0.97 | 19.2 | 5.5 | 1.19 | .290 | 3.96 | 8.70 |
| 8 | | D. Cone | 2,668 | 450 | 194 | 126 | .606 | 419 | 3.47 | 56 | 22 | 1 | 2898.2 | 2,504 | 1,116 | 1,222 | 258 | 1,137 | 106 | 9 | 42 | 12,184 | 149 | 8.28 | 3.53 | 2.35 | 0.80 | 21.9 | 9.3 | 1.26 | .280 | 3.79 | 7.77 |
| 9 | | C. Finley | 2,610 | 524 | 200 | 173 | .536 | 467 | 3.85 | 63 | 15 | 0 | 3197.1 | 3,069 | 1,366 | 1,517 | 304 | 1,332 | 76 | 24 | 36 | 13,638 | 130 | 7.35 | 3.75 | 1.96 | 0.86 | 19.1 | 9.8 | 1.38 | .297 | 4.27 | 8.64 |
| 10 | | T. Glavine | 2,576 | 672 | 303 | 200 | .602 | 672 | 3.50 | 56 | 25 | 0 | 4361.1 | 4,244 | 1,698 | 1,864 | 345 | 1,469 | 65 | 0 | 141 | 18,373 | 65 | 5.32 | 3.03 | 1.75 | 0.71 | 14.0 | 8.0 | 1.31 | .280 | 3.85 | 8.76 |
| 11 | | M. Langston | 2,464 | 457 | 179 | 158 | .531 | 428 | 3.97 | 81 | 18 | 0 | 2962.2 | 2,723 | 1,306 | 1,438 | 311 | 1,289 | 46 | 3 | 34 | 12,562 | 89 | 7.49 | 3.92 | 1.91 | 0.94 | 19.6 | 10.3 | 1.35 | .285 | 4.37 | 8.27 |
| 12 |  | N. Ryan | 2,430 | 347 | 132 | 113 | .539 | 347 | 3.25 | 43 | 14 | 0 | 2266.2 | 1,676 | 818 | 932 | 156 | 964 | 73 | 0 | 34 | 9,378 | 123 | 9.65 | 3.83 | 2.52 | 0.62 | 25.9 | 10.3 | 1.16 | .264 | 3.70 | 6.65 |
| 13 | | K. Brown | 2,397 | 486 | 211 | 144 | .594 | 476 | 3.28 | 72 | 17 | 0 | 3256.1 | 3,079 | 1,185 | 1,357 | 208 | 901 | 139 | 1 | 42 | 13,542 | 108 | 6.62 | 2.49 | 2.66 | 0.57 | 17.7 | 6.7 | 1.22 | .290 | 3.75 | 8.51 |
| 14 | | D. Gooden | 2,293 | 430 | 194 | 112 | .634 | 410 | 3.51 | 68 | 24 | 3 | 2800.2 | 2,564 | 1,091 | 1,198 | 210 | 954 | 78 | 4 | 42 | 11,705 | 76 | 7.37 | 3.07 | 2.40 | 0.67 | 19.6 | 8.2 | 1.26 | .288 | 3.85 | 8.24 |
| 15 | | D. Wells | 2,201 | 660 | 239 | 157 | .604 | 489 | 4.13 | 54 | 12 | 13 | 3439.0 | 3,635 | 1,578 | 1,702 | 407 | 719 | 83 | 65 | 65 | 14,413 | 101 | 5.76 | 1.88 | 3.06 | 1.07 | 15.3 | 5.0 | 1.27 | .293 | 4.45 | 9.51 |
| 16 | | J. Moyer | 2,136 | 609 | 231 | 179 | .563 | 556 | 4.21 | 31 | 9 | 0 | 3577.0 | 3,714 | 1,674 | 1,811 | 446 | 1,021 | 118 | 14 | 64 | 15,223 | 53 | 5.37 | 2.57 | 2.09 | 1.12 | 14.0 | 6.7 | 1.32 | .284 | 4.56 | 9.34 |
| 17 |  | J. Morris | 2,048 | 418 | 198 | 148 | .572 | 418 | 3.97 | 134 | 24 | 0 | 2966.2 | 2,787 | 1,309 | 1,443 | 318 | 1,075 | 45 | 0 | 72 | 12,543 | 180 | 6.21 | 3.26 | 1.91 | 0.96 | 16.3 | 8.6 | 1.30 | .273 | 4.38 | 8.45 |
| 18 | | O. Hershiser | 2,014 | 510 | 204 | 150 | .576 | 466 | 3.48 | 68 | 25 | 5 | 3130.1 | 2,939 | 1,211 | 1,367 | 235 | 1,007 | 117 | 19 | 108 | 13,150 | 121 | 5.79 | 2.90 | 2.00 | 0.68 | 15.3 | 7.7 | 1.26 | .277 | 3.93 | 8.45 |
| 19 | | A. Benes | 2,000 | 403 | 155 | 139 | .527 | 387 | 3.97 | 21 | 9 | 1 | 2505.1 | 2,377 | 1,106 | 1,206 | 289 | 909 | 55 | 6 | 52 | 10,645 | 63 | 7.18 | 3.27 | 2.20 | 1.04 | 18.8 | 8.5 | 1.31 | .282 | 4.33 | 8.54 |
| 20 | | K. Appier | 1,994 | 414 | 169 | 137 | .552 | 402 | 3.74 | 34 | 12 | 0 | 2595.1 | 2,425 | 1,078 | 1,168 | 232 | 933 | 79 | 2 | 51 | 10,958 | 106 | 6.91 | 3.24 | 2.14 | 0.80 | 18.2 | 8.5 | 1.29 | .284 | 4.05 | 8.41 |
| 21 | | A. Leiter | 1,974 | 419 | 162 | 132 | .551 | 382 | 3.80 | 16 | 10 | 2 | 2391.0 | 2,152 | 1,010 | 1,101 | 198 | 1,163 | 117 | 9 | 53 | 10,334 | 63 | 7.43 | 4.38 | 1.70 | 0.75 | 19.1 | 11.3 | 1.39 | .284 | 4.14 | 8.10 |
| 22 | | B. Witt | 1,955 | 430 | 142 | 157 | .475 | 397 | 4.83 | 47 | 11 | 0 | 2465.0 | 2,493 | 1,324 | 1,449 | 252 | 1,375 | 39 | 13 | 37 | 11,003 | 128 | 7.14 | 5.02 | 1.42 | 0.92 | 17.8 | 12.5 | 1.57 | .304 | 5.29 | 9.10 |
| 23 | | H. Nomo | 1,918 | 323 | 123 | 109 | .530 | 318 | 4.24 | 16 | 9 | 0 | 1976.1 | 1,768 | 932 | 993 | 251 | 908 | 38 | 2 | 31 | 8,462 | 110 | 8.73 | 4.13 | 2.11 | 1.14 | 22.7 | 10.7 | 1.35 | .284 | 4.52 | 8.05 |
| 24 | | T. Gordon | 1,914 | 864 | 135 | 123 | .523 | 203 | 3.94 | 18 | 4 | 157 | 2086.1 | 1,864 | 913 | 1,000 | 173 | 963 | 38 | 341 | 56 | 8,954 | 106 | 8.26 | 4.15 | 1.99 | 0.75 | 21.4 | 10.8 | 1.36 | .288 | 4.31 | 8.04 |
| 25 | | K. Rogers | 1,895 | 737 | 211 | 146 | .591 | 449 | 4.22 | 36 | 9 | 28 | 3153.2 | 3,277 | 1,479 | 1,643 | 319 | 1,119 | 119 | 133 | 50 | 13,616 | 78 | 5.41 | 3.19 | 1.69 | 0.91 | 13.9 | 8.2 | 1.39 | .291 | 4.69 | 9.35 |
More MLB News
Phillies name Pete Fatse their hitting coach, Joe Cronin hired as assistant hitting coach
Brewers' Robert Gasser spins World Series gem unlike any by a lefty since Sandy Koufax

Brewers rout the Rays 10-1 to move within a win of their first World Series title
Rays put on the brink of World Series flop by Brewers' historic 8-run, 2-out surge

Roberto Clemente Award List
MLB Potential Free Agents List
More Red Sox Stats
Team Batting Leaders 

HR
1
Contreras
RBI
1
Contreras
AVG
.500
Eaton
Team Pitching Leaders 

K
5
Gray
ERA
0.00
Chapman
Team Rankings
HR
163
26th
R
689
23rd
SO
1,398
11th
ERA
3.54
3rd
 Orioles
 Blue Jays

MLB 2026 Batting Leaders


MLB 2026 Pitching Leaders


MLB Fantasy 2026
MLB 2026 Betting


MLB 2026 Standings
| NL East | W | L | PCT | GB |
|---|---|---|---|---|
 Braves - y | 94 | 68 | .580 | |
 Phillies - w | 88 | 74 | .543 | 6.0 |
80 | 82 | .494 | 14.0 | |
77 | 85 | .475 | 17.0 | |
74 | 88 | .457 | 20.0 | |
| NL Central | W | L | PCT | GB |
 Brewers - y | 103 | 59 | .636 | |
 Cubs - w | 89 | 73 | .549 | 14.0 |
82 | 80 | .506 | 21.0 | |
77 | 85 | .475 | 26.0 | |
75 | 87 | .463 | 28.0 | |
| NL West | W | L | PCT | GB |
 Dodgers - y | 100 | 62 | .617 | |
 Padres - w | 91 | 71 | .562 | 9.0 |
86 | 76 | .531 | 14.0 | |
65 | 97 | .401 | 35.0 | |
58 | 104 | .358 | 42.0 |
 Marlins
 Nationals
 Mets
 Pirates
 Cardinals
 Reds
 Diamondbacks
 Giants
 Rockies
| AL East | W | L | PCT | GB |
|---|---|---|---|---|
 Rays - y | 98 | 64 | .605 | |
 Yankees - w | 93 | 68 | .578 | 4.5 |
 Red Sox - w | 87 | 75 | .537 | 11.0 |
79 | 82 | .491 | 18.5 | |
79 | 83 | .488 | 19.0 | |
| AL Central | W | L | PCT | GB |
 Guardians - y | 85 | 77 | .525 | |
 White Sox - w | 84 | 78 | .519 | 1.0 |
77 | 85 | .475 | 8.0 | |
76 | 86 | .469 | 9.0 | |
69 | 93 | .426 | 16.0 | |
| AL West | W | L | PCT | GB |
 Astros - y | 81 | 81 | .500 | |
80 | 82 | .494 | 1.0 | |
76 | 86 | .469 | 5.0 | |
64 | 98 | .395 | 17.0 | |
62 | 100 | .383 | 19.0 |
 Twins
 Tigers
 Royals
 Rangers
 Mariners
 Athletics
 Angels