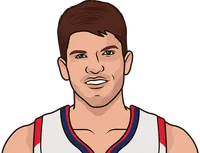
Kyle Korver has the best three-point percentage with 300+ three-point attempts in a season, at 49.2 percent in 2014-15.
Showing
| NAME | 3P% | 3PA | SEASON | TM | 3PM | GP | MPG | PPG | RPG | APG | SPG | BPG | FGM | FGA | FG% | FTM | FTA | FT% | TS% | OREB | DREB | TPG | MIN | PTS | REB | AST | STL | BLK | TOV | PF | +/- | ||
|---|---|---|---|---|---|---|---|---|---|---|---|---|---|---|---|---|---|---|---|---|---|---|---|---|---|---|---|---|---|---|---|---|---|
| 1 |  | K. Korver | 49.2 | 449 | 2014-15 | 221 | 75 | 32.2 | 12.1 | 4.1 | 2.6 | 0.7 | 0.6 | 3.9 | 8.0 | 48.7 | 1.4 | 1.6 | 89.8 | 69.9 | 0.2 | 3.9 | 1.4 | 2,418 | 911 | 304 | 196 | 52 | 42 | 107 | 140 | +620 | |
| 2 |  | J. Johnson | 47.8 | 370 | 2004-05 | 177 | 82 | 39.5 | 17.1 | 5.1 | 3.5 | 1.0 | 0.3 | 6.6 | 14.4 | 46.1 | 1.6 | 2.2 | 75.0 | 55.6 | 1.5 | 3.7 | 1.8 | 3,240 | 1,400 | 422 | 291 | 79 | 24 | 148 | 167 | +567 | |
| 3 |  | D. Ellis | 47.8 | 339 | 1988-89 | 162 | 82 | 38.9 | 27.5 | 4.2 | 2.0 | 1.3 | 0.3 | 10.5 | 20.9 | 50.1 | 4.6 | 5.6 | 81.6 | 58.9 | 1.9 | 2.3 | 2.7 | 3,190 | 2,253 | 342 | 164 | 108 | 22 | 218 | 197 | ||
| 4 |  | J. Harris | 47.5 | 444 | 2020-21 | 211 | 69 | 31.0 | 14.1 | 3.6 | 1.9 | 0.7 | 0.2 | 5.2 | 10.2 | 50.5 | 0.7 | 0.9 | 77.8 | 66.3 | 0.6 | 3.0 | 0.9 | 2,141 | 974 | 248 | 130 | 46 | 14 | 62 | 141 | +350 | |
| 5 |  | JJ Redick | 47.5 | 421 | 2015-16 | 200 | 75 | 28.0 | 16.3 | 1.9 | 1.4 | 0.6 | 0.1 | 5.6 | 11.7 | 48.0 | 2.4 | 2.7 | 88.8 | 63.2 | 0.1 | 1.7 | 1.0 | 2,097 | 1,226 | 139 | 106 | 42 | 5 | 78 | 135 | +509 | |
| 6 | | J. Harris | 47.4 | 386 | 2018-19 | 183 | 76 | 30.2 | 13.7 | 3.8 | 2.4 | 0.5 | 0.2 | 4.9 | 9.8 | 50.0 | 1.4 | 1.8 | 82.7 | 64.5 | 0.7 | 3.1 | 1.6 | 2,293 | 1,041 | 291 | 181 | 38 | 17 | 121 | 182 | -78 | |
| 7 | | K. Korver | 47.2 | 392 | 2013-14 | 185 | 71 | 33.9 | 12.0 | 4.0 | 2.9 | 1.0 | 0.3 | 4.1 | 8.6 | 47.5 | 1.2 | 1.3 | 92.6 | 65.3 | 0.3 | 3.7 | 1.4 | 2,408 | 850 | 282 | 208 | 70 | 24 | 102 | 147 | +212 | |
| 8 |  | G. Rice | 47.0 | 440 | 1996-97 | 207 | 79 | 42.6 | 26.8 | 4.0 | 2.0 | 0.9 | 0.3 | 9.1 | 19.2 | 47.7 | 5.9 | 6.8 | 86.7 | 60.5 | 0.8 | 3.2 | 2.2 | 3,362 | 2,115 | 318 | 160 | 72 | 26 | 177 | 190 | +176 | |
| 9 |  | S. Nash | 47.0 | 381 | 2007-08 | 179 | 81 | 34.3 | 16.9 | 3.5 | 11.1 | 0.7 | 0.1 | 6.0 | 11.9 | 50.4 | 2.7 | 3.0 | 90.6 | 64.1 | 0.3 | 3.1 | 3.6 | 2,780 | 1,371 | 282 | 898 | 53 | 5 | 295 | 113 | +548 | |
| 10 |  | D. Barros | 46.4 | 425 | 1994-95 | 197 | 82 | 40.5 | 20.6 | 3.3 | 7.5 | 1.8 | 0.0 | 7.0 | 14.2 | 49.0 | 4.2 | 4.7 | 89.9 | 63.2 | 0.3 | 3.0 | 3.0 | 3,318 | 1,686 | 274 | 619 | 149 | 4 | 242 | 159 | ||
| 11 |  | B. Price | 46.2 | 301 | 1995-96 | 139 | 81 | 25.2 | 10.0 | 2.8 | 5.1 | 1.0 | 0.0 | 3.1 | 6.6 | 47.2 | 2.1 | 2.4 | 87.4 | 65.5 | 0.5 | 2.3 | 1.9 | 2,042 | 810 | 228 | 416 | 78 | 4 | 153 | 184 | ||
| 12 |  | G. Allen | 46.1 | 445 | 2023-24 | 205 | 75 | 33.5 | 13.5 | 3.9 | 3.0 | 0.9 | 0.6 | 4.5 | 9.1 | 49.9 | 1.7 | 2.0 | 87.8 | 67.9 | 0.6 | 3.3 | 1.3 | 2,513 | 1,014 | 295 | 227 | 69 | 45 | 95 | 157 | +262 | |
| 13 | | K. Korver | 45.7 | 414 | 2012-13 | 189 | 74 | 30.5 | 10.9 | 4.0 | 2.0 | 0.9 | 0.5 | 3.7 | 8.1 | 46.1 | 0.9 | 1.1 | 85.9 | 63.7 | 0.3 | 3.6 | 0.9 | 2,259 | 810 | 293 | 146 | 70 | 37 | 70 | 170 | +198 | |
| 14 |  | A. Morrow | 45.6 | 307 | 2009-10 | 140 | 69 | 29.2 | 13.0 | 3.8 | 1.5 | 0.9 | 0.2 | 4.8 | 10.2 | 46.8 | 1.5 | 1.7 | 88.6 | 59.7 | 0.9 | 2.9 | 1.2 | 2,018 | 899 | 259 | 104 | 65 | 16 | 84 | 158 | -60 | |
| 15 |  | D. Green | 45.5 | 435 | 2018-19 | 198 | 80 | 27.7 | 10.3 | 4.0 | 1.6 | 0.9 | 0.7 | 3.7 | 7.9 | 46.5 | 0.5 | 0.6 | 84.1 | 63.2 | 0.8 | 3.2 | 0.9 | 2,215 | 821 | 317 | 126 | 73 | 53 | 75 | 171 | +638 | |
| 16 | | S. Nash | 45.5 | 343 | 2006-07 | 156 | 76 | 35.3 | 18.6 | 3.5 | 11.6 | 0.8 | 0.1 | 6.8 | 12.8 | 53.2 | 2.9 | 3.3 | 89.9 | 65.4 | 0.4 | 3.1 | 3.8 | 2,682 | 1,412 | 269 | 884 | 57 | 6 | 287 | 117 | +609 | |
| 17 |  | S. Nash | 45.5 | 343 | 2001-02 | 156 | 82 | 34.6 | 17.9 | 3.1 | 7.7 | 0.6 | 0.0 | 6.4 | 13.3 | 48.3 | 3.2 | 3.6 | 88.7 | 60.2 | 0.6 | 2.5 | 2.8 | 2,837 | 1,466 | 254 | 634 | 53 | 4 | 229 | 164 | +308 | |
| 18 |  | S. Curry | 45.4 | 886 | 2015-16 | 402 | 79 | 34.2 | 30.1 | 5.4 | 6.7 | 2.1 | 0.2 | 10.2 | 20.2 | 50.4 | 4.6 | 5.1 | 90.8 | 66.9 | 0.9 | 4.6 | 3.3 | 2,700 | 2,375 | 430 | 527 | 169 | 15 | 262 | 161 | +1022 | |
| 19 |  | JJ Redick | 45.3 | 397 | 2019-20 | 180 | 60 | 26.4 | 15.3 | 2.5 | 2.0 | 0.3 | 0.2 | 4.8 | 10.5 | 45.3 | 2.8 | 3.1 | 89.2 | 64.4 | 0.2 | 2.4 | 1.3 | 1,581 | 917 | 151 | 119 | 20 | 10 | 75 | 96 | -21 | |
| 20 | | S. Curry | 45.3 | 600 | 2012-13 | 272 | 78 | 38.2 | 22.9 | 4.0 | 6.9 | 1.6 | 0.2 | 8.0 | 17.8 | 45.1 | 3.4 | 3.7 | 90.0 | 58.9 | 0.8 | 3.3 | 3.1 | 2,983 | 1,786 | 314 | 539 | 126 | 12 | 240 | 198 | +135 | |
| 21 |  | S. Curry | 45.2 | 321 | 2019-20 | 145 | 64 | 24.6 | 12.4 | 2.3 | 1.9 | 0.6 | 0.1 | 4.4 | 9.0 | 49.5 | 1.3 | 1.5 | 82.5 | 64.3 | 0.4 | 1.8 | 1.0 | 1,576 | 793 | 145 | 124 | 38 | 9 | 62 | 113 | +161 | |
| 22 |  | B. Forbes | 45.2 | 341 | 2020-21 | 154 | 70 | 19.3 | 10.0 | 1.6 | 0.6 | 0.3 | 0.0 | 3.6 | 7.6 | 47.3 | 0.7 | 0.9 | 77.0 | 63.1 | 0.2 | 1.4 | 0.6 | 1,354 | 701 | 112 | 45 | 24 | 1 | 44 | 77 | +101 | |
| 23 |  | K. Korver | 45.1 | 359 | 2016-17 | TOT | 162 | 67 | 26.2 | 10.1 | 2.8 | 1.6 | 0.5 | 0.3 | 3.6 | 7.7 | 46.4 | 0.6 | 0.6 | 90.5 | 63.5 | 0.1 | 2.7 | 1.0 | 1,753 | 678 | 186 | 110 | 34 | 21 | 69 | 107 | -171 |
| 24 |  | J. Ingles | 45.1 | 406 | 2020-21 | 183 | 67 | 27.9 | 12.1 | 3.6 | 4.7 | 0.7 | 0.2 | 4.1 | 8.4 | 48.9 | 1.1 | 1.3 | 84.4 | 67.2 | 0.4 | 3.2 | 1.7 | 1,866 | 809 | 244 | 318 | 45 | 12 | 117 | 120 | +454 | |
| 25 |  | T. Murphy | 45.0 | 358 | 2008-09 | 161 | 73 | 34.0 | 14.3 | 11.8 | 2.4 | 0.8 | 0.5 | 5.0 | 10.5 | 47.5 | 2.1 | 2.5 | 82.6 | 61.4 | 2.0 | 9.8 | 1.6 | 2,482 | 1,041 | 861 | 172 | 58 | 34 | 114 | 226 | -48 | |
 ATL
 PHX
 SEA
 BKN
 LAC
 CHA
 PHI
 WAS
 GSW
 TOR
 DAL
 GSW
 NOP
 MIL
 UTA
 IND
More NBA News
East-leading 76ers survive challenge from last-place Bucks

Kyrie Irving scores 25, Cooper Flagg 22 as the Mavericks top the Clippers 110-100

Jaden McDaniels scores 25 and Timberwolves top short-handed Grizzlies 104-95

Brunson scores 30, Bridges hits 3 at buzzer, lifting Knicks to 97-96 win over Trail Blazers

Victor Wembanyama has 50 points, 19 rebounds on dominant night as Spurs roll past Pelicans, 114-91

We watch Rocky: LeBron James organizes 76ers' movie night with screening of 'I Play Rocky'
More Hawks Stats
Team Leaders 

PPG
20.9
Alexander-Walker
RPG
9.0
Johnson
APG
7.5
Johnson
Team Rankings
ORTG
114.0
18th
DRTG
111.3
8th
NETRTG
2.6
12th
3P%
34.5
18th
 Celtics
 Pistons
 Hawks
 Knicks
 Heat


NBA 2026-27 Leaders


NBA 2026-27 Rankings


NBA Fantasy 2026-27


NBA 2026-27 Betting


NBA 2026-27 Standings
| Eastern | W | L | PCT | GB | |
|---|---|---|---|---|---|
| 1 | 14 | 3 | .824 | ||
| 2 | 11 | 5 | .688 | 2.5 | |
| 3 | 10 | 5 | .667 | 3.0 | |
| 4 | 10 | 6 | .625 | 3.5 | |
| 5 | 10 | 6 | .625 | 3.5 | |
| 6 | 9 | 6 | .600 | 4.0 | |
| 7 | 9 | 8 | .529 | 5.0 | |
| 8 | 7 | 8 | .467 | 6.0 | |
| 9 | 6 | 10 | .375 | 7.5 | |
| 10 | 6 | 11 | .353 | 8.0 | |
| 11 | 5 | 11 | .313 | 8.5 | |
| 12 | 4 | 11 | .267 | 9.0 | |
| 13 | 4 | 11 | .267 | 9.0 | |
| 14 | 3 | 12 | .200 | 10.0 | |
| 15 | 1 | 16 | .059 | 13.0 |
 Cavaliers
 Magic
 Wizards
 Hornets
 Bulls
| Western | W | L | PCT | GB | |
|---|---|---|---|---|---|
| 1 | 14 | 3 | .824 | ||
| 2 | 14 | 3 | .824 | ||
| 3 | 12 | 5 | .706 | 2.0 | |
| 4 | 12 | 5 | .706 | 2.0 | |
| 5 | 12 | 5 | .706 | 2.0 | |
| 6 | 9 | 5 | .643 | 3.5 | |
| 7 | 10 | 6 | .625 | 3.5 | |
| 8 | 10 | 6 | .625 | 3.5 | |
| 9 | 9 | 7 | .563 | 4.5 | |
| 10 | 8 | 7 | .533 | 5.0 | |
| 11 | 8 | 8 | .500 | 5.5 | |
| 12 | 5 | 13 | .278 | 9.5 | |
| 13 | 4 | 11 | .267 | 9.0 | |
| 14 | 3 | 14 | .176 | 11.0 | |
| 15 | 2 | 14 | .125 | 11.5 |
 Spurs
 Lakers
 Timberwolves
 Rockets
 Grizzlies
 Nuggets
 Trail Blazers
 Thunder
 Warriors
 Clippers
 Jazz
 Kings