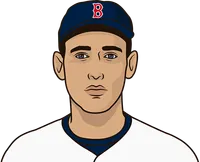
Ted Williams had the best batting average when making 3,000+ plate appearances in the 1950s, with an average of .336.
| NAME | AVG | PA | G | AB | R | H | 2B | 3B | HR | RBI | BB | HBP | SO | SB | CS | TB | XBH | SH | SF | IBB | GIDP | OBP | SLG | OPS | wRC | WRAA | wOBA | wRC+ | BRAA | ||
|---|---|---|---|---|---|---|---|---|---|---|---|---|---|---|---|---|---|---|---|---|---|---|---|---|---|---|---|---|---|---|---|
| 1 |  | T. Williams | .336 | 4,053 | 995 | 3,175 | 660 | 1,068 | 196 | 15 | 227 | 729 | 845 | 15 | 292 | 7 | 3 | 1,975 | 438 | 0 | 18 | 79 | 91 | .476 | .622 | 1.098 | 942 | 472.7 | .477 | 184 | 412.4 |
| 2 |  | S. Musial | .330 | 6,272 | 1,456 | 5,366 | 948 | 1,771 | 356 | 61 | 266 | 972 | 842 | 24 | 339 | 28 | 30 | 3,047 | 683 | 7 | 33 | 90 | 133 | .421 | .568 | .989 | 1240 | 514.7 | .435 | 157 | 446.2 |
| 3 |  | H. Aaron | .323 | 3,866 | 886 | 3,524 | 612 | 1,137 | 205 | 46 | 179 | 617 | 281 | 13 | 315 | 20 | 9 | 1,971 | 430 | 18 | 30 | 59 | 107 | .372 | .559 | .931 | 682 | 240.7 | .403 | 150 | 239.1 |
| 4 |  | W. Mays | .317 | 4,629 | 1,065 | 4,074 | 777 | 1,291 | 204 | 79 | 250 | 709 | 505 | 14 | 435 | 179 | 53 | 2,403 | 533 | 1 | 35 | 69 | 89 | .391 | .590 | .981 | 887 | 358.3 | .424 | 155 | 317.8 |
| 5 |  | H. Kuenn | .314 | 4,750 | 1,049 | 4,372 | 619 | 1,372 | 244 | 43 | 53 | 423 | 322 | 8 | 205 | 51 | 43 | 1,861 | 340 | 21 | 27 | 19 | 84 | .360 | .426 | .786 | 644 | 98.5 | .352 | 111 | 65.1 |
| 6 | | R. Ashburn | .313 | 6,965 | 1,523 | 5,997 | 952 | 1,875 | 252 | 82 | 19 | 422 | 828 | 37 | 395 | 158 | 75 | 2,348 | 353 | 90 | 13 | 20 | 63 | .399 | .392 | .790 | 1003 | 199.3 | .365 | 117 | 148.9 |
| 7 |  | J. Robinson | .311 | 3,751 | 928 | 3,120 | 592 | 970 | 166 | 29 | 97 | 477 | 523 | 48 | 191 | 109 | 30 | 1,485 | 292 | 51 | 9 | 7 | 79 | .416 | .476 | .892 | 656 | 218.3 | .408 | 138 | 179.1 |
| 8 | | A. Kaline | .311 | 3,777 | 904 | 3,368 | 521 | 1,047 | 156 | 34 | 125 | 544 | 344 | 16 | 289 | 51 | 31 | 1,646 | 315 | 19 | 30 | 41 | 84 | .374 | .489 | .863 | 598 | 166.6 | .380 | 130 | 138.2 |
| 9 |  | M. Mantle | .311 | 5,409 | 1,246 | 4,478 | 994 | 1,392 | 208 | 54 | 280 | 841 | 892 | 9 | 899 | 98 | 25 | 2,548 | 542 | 12 | 18 | 54 | 44 | .425 | .569 | .994 | 1086 | 467.8 | .437 | 172 | 466 |
| 10 | | G. Kell | .308 | 4,100 | 999 | 3,617 | 490 | 1,114 | 224 | 16 | 60 | 521 | 367 | 22 | 185 | 23 | 11 | 1,550 | 300 | 74 | 20 | 7 | 95 | .373 | .429 | .802 | 588 | 108.8 | .366 | 114 | 70.4 |
| 11 | | D. Snider | .308 | 6,010 | 1,418 | 5,219 | 970 | 1,605 | 274 | 57 | 326 | 1,031 | 711 | 11 | 851 | 77 | 48 | 2,971 | 657 | 44 | 25 | 74 | 132 | .390 | .569 | .959 | 1122 | 425.7 | .420 | 147 | 353.8 |
| 12 | | M. Minoso | .306 | 5,866 | 1,337 | 4,979 | 898 | 1,526 | 259 | 74 | 145 | 790 | 648 | 149 | 413 | 167 | 106 | 2,368 | 478 | 57 | 33 | 17 | 141 | .400 | .476 | .875 | 983 | 311.7 | .395 | 140 | 283.8 |
| 13 | | T. Kluszewski | .302 | 5,016 | 1,272 | 4,565 | 683 | 1,380 | 220 | 23 | 239 | 823 | 408 | 23 | 274 | 16 | 9 | 2,363 | 482 | 3 | 17 | 60 | 112 | .361 | .518 | .879 | 807 | 224.4 | .388 | 127 | 168.5 |
| 14 | | B. Goodman | .302 | 5,076 | 1,209 | 4,456 | 666 | 1,347 | 237 | 38 | 17 | 442 | 505 | 22 | 237 | 30 | 23 | 1,711 | 292 | 79 | 14 | 4 | 80 | .375 | .384 | .759 | 673 | 85.4 | .351 | 103 | 19.9 |
| 15 | | N. Fox | .300 | 6,845 | 1,512 | 6,115 | 902 | 1,837 | 254 | 82 | 27 | 534 | 487 | 92 | 138 | 68 | 62 | 2,336 | 363 | 125 | 26 | 17 | 105 | .360 | .382 | .742 | 848 | 59.6 | .340 | 103 | 24.5 |
| 16 | | C. Furillo | .299 | 5,147 | 1,307 | 4,683 | 654 | 1,399 | 235 | 28 | 159 | 784 | 369 | 40 | 329 | 25 | 26 | 2,167 | 422 | 31 | 24 | 28 | 157 | .353 | .463 | .816 | 739 | 141.6 | .365 | 112 | 81.7 |
| 17 | | S. Burgess | .298 | 3,090 | 930 | 2,751 | 339 | 820 | 156 | 24 | 80 | 404 | 302 | 7 | 167 | 10 | 10 | 1,264 | 260 | 9 | 21 | 26 | 76 | .366 | .459 | .826 | 455 | 101.1 | .369 | 118 | 68.1 |
| 18 | | F. Fain | .297 | 3,021 | 720 | 2,424 | 363 | 721 | 137 | 13 | 31 | 333 | 560 | 13 | 139 | 24 | 12 | 977 | 181 | 16 | 8 | 3 | 70 | .431 | .403 | .834 | 492 | 138.4 | .394 | 130 | 111.8 |
| 19 | | R. Schoendienst | .297 | 5,587 | 1,272 | 5,107 | 732 | 1,517 | 284 | 51 | 69 | 511 | 383 | 16 | 209 | 34 | 27 | 2,110 | 404 | 62 | 19 | 7 | 121 | .347 | .413 | .760 | 710 | 63.7 | .345 | 102 | 17.4 |
| 20 | | D. Mueller | .296 | 4,451 | 1,158 | 4,227 | 482 | 1,250 | 131 | 36 | 64 | 510 | 162 | 13 | 137 | 11 | 8 | 1,645 | 231 | 28 | 21 | 12 | 87 | .322 | .389 | .711 | 484 | -32.1 | .322 | 87 | -69 |
| 21 |  | E. Banks | .295 | 3,954 | 922 | 3,562 | 582 | 1,051 | 156 | 48 | 228 | 661 | 327 | 23 | 433 | 35 | 34 | 1,987 | 432 | 10 | 32 | 67 | 78 | .355 | .558 | .913 | 666 | 215.5 | .393 | 135 | 172.8 |
| 22 | | B. Nieman | .293 | 3,610 | 955 | 3,151 | 433 | 924 | 158 | 27 | 118 | 497 | 403 | 7 | 465 | 9 | 29 | 1,490 | 303 | 26 | 23 | 17 | 99 | .372 | .473 | .845 | 558 | 146.1 | .377 | 130 | 131.2 |
| 23 | | W. Moon | .293 | 3,546 | 847 | 3,117 | 493 | 914 | 139 | 47 | 97 | 405 | 388 | 9 | 339 | 63 | 45 | 1,438 | 283 | 13 | 19 | 29 | 66 | .371 | .461 | .832 | 532 | 127.2 | .370 | 119 | 84.1 |
| 24 | | V. Power | .293 | 3,443 | 822 | 3,240 | 452 | 949 | 155 | 37 | 81 | 359 | 157 | 9 | 119 | 19 | 22 | 1,421 | 273 | 16 | 21 | 15 | 75 | .325 | .439 | .764 | 432 | 38.6 | .338 | 102 | 10 |
| 25 | | J. Temple | .292 | 4,219 | 978 | 3,629 | 533 | 1,058 | 149 | 30 | 15 | 300 | 469 | 11 | 224 | 105 | 32 | 1,312 | 194 | 79 | 31 | 2 | 51 | .371 | .362 | .733 | 527 | 45.8 | .338 | 97 | -15 |
More MLB News
Phillies name Pete Fatse their hitting coach, hire Joe Cronin as assistant hitting coach
Brewers' Robert Gasser spins World Series gem unlike any by a lefty since Sandy Koufax

Brewers rout the Rays 10-1 to move within a win of their first World Series title
Rays put on the brink of World Series flop by Brewers' historic 8-run, 2-out surge

Roberto Clemente Award List
MLB Potential Free Agents List
More Red Sox Stats
Team Batting Leaders 

HR
1
Contreras
RBI
1
Contreras
AVG
.500
Eaton
Team Pitching Leaders 

K
5
Gray
ERA
0.00
Chapman
Team Rankings
HR
163
26th
R
689
23rd
SO
1,398
11th
ERA
3.54
3rd
 Orioles
 Blue Jays

MLB 2026 Batting Leaders


MLB 2026 Pitching Leaders


MLB Fantasy 2026
MLB 2026 Betting


MLB 2026 Standings
| NL East | W | L | PCT | GB |
|---|---|---|---|---|
 Braves - y | 94 | 68 | .580 | |
 Phillies - w | 88 | 74 | .543 | 6.0 |
80 | 82 | .494 | 14.0 | |
77 | 85 | .475 | 17.0 | |
74 | 88 | .457 | 20.0 | |
| NL Central | W | L | PCT | GB |
 Brewers - y | 103 | 59 | .636 | |
 Cubs - w | 89 | 73 | .549 | 14.0 |
82 | 80 | .506 | 21.0 | |
77 | 85 | .475 | 26.0 | |
75 | 87 | .463 | 28.0 | |
| NL West | W | L | PCT | GB |
 Dodgers - y | 100 | 62 | .617 | |
 Padres - w | 91 | 71 | .562 | 9.0 |
86 | 76 | .531 | 14.0 | |
65 | 97 | .401 | 35.0 | |
58 | 104 | .358 | 42.0 |
 Marlins
 Nationals
 Mets
 Pirates
 Cardinals
 Reds
 Diamondbacks
 Giants
 Rockies
| AL East | W | L | PCT | GB |
|---|---|---|---|---|
 Rays - y | 98 | 64 | .605 | |
 Yankees - w | 93 | 68 | .578 | 4.5 |
 Red Sox - w | 87 | 75 | .537 | 11.0 |
79 | 82 | .491 | 18.5 | |
79 | 83 | .488 | 19.0 | |
| AL Central | W | L | PCT | GB |
 Guardians - y | 85 | 77 | .525 | |
 White Sox - w | 84 | 78 | .519 | 1.0 |
77 | 85 | .475 | 8.0 | |
76 | 86 | .469 | 9.0 | |
69 | 93 | .426 | 16.0 | |
| AL West | W | L | PCT | GB |
 Astros - y | 81 | 81 | .500 | |
80 | 82 | .494 | 1.0 | |
76 | 86 | .469 | 5.0 | |
64 | 98 | .395 | 17.0 | |
62 | 100 | .383 | 19.0 |
 Twins
 Tigers
 Royals
 Rangers
 Mariners
 Athletics
 Angels