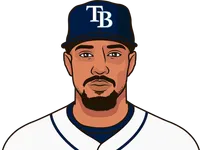
Since 2016, Chandler Simpson has smashed the fewest homers when making 800+ plate appearances, with 0 home runs.
Showing
| NAME | HR | PA | G | AB | R | H | 2B | 3B | RBI | BB | HBP | SO | SB | CS | TB | XBH | SH | SF | IBB | GIDP | AVG | OBP | SLG | OPS | wRC | WRAA | wOBA | wRC+ | BRAA | ||
|---|---|---|---|---|---|---|---|---|---|---|---|---|---|---|---|---|---|---|---|---|---|---|---|---|---|---|---|---|---|---|---|
| 1 |  | C. Simpson | 0 | 1,051 | 260 | 985 | 119 | 297 | 31 | 9 | 64 | 46 | 0 | 91 | 90 | 26 | 346 | 40 | 12 | 8 | 1 | 16 | .302 | .330 | .351 | .681 | 113 | -11.8 | .301 | 91 | -11.7 |
| 2 |  | N. Madrigal | 4 | 1,003 | 304 | 922 | 104 | 253 | 41 | 5 | 80 | 50 | 21 | 88 | 18 | 7 | 316 | 50 | 8 | 2 | 0 | 20 | .274 | .326 | .343 | .668 | 106 | -14 | .297 | 88 | -14 |
| 3 | | Y. Daza | 4 | 924 | 288 | 844 | 97 | 237 | 40 | 5 | 74 | 57 | 7 | 152 | 4 | 4 | 299 | 49 | 8 | 8 | 0 | 28 | .281 | .329 | .354 | .683 | 100 | -9.7 | .301 | 75 | -29.3 |
| 4 | | L. Guillorme | 5 | 1,031 | 423 | 902 | 92 | 224 | 42 | 3 | 58 | 115 | 2 | 175 | 8 | 4 | 287 | 50 | 8 | 4 | 4 | 36 | .248 | .333 | .318 | .652 | 105 | -16.9 | .293 | 88 | -14.6 |
| 5 | | T. Wade | 7 | 990 | 506 | 876 | 152 | 189 | 29 | 5 | 60 | 88 | 9 | 235 | 51 | 16 | 249 | 41 | 16 | 1 | 1 | 10 | .216 | .294 | .284 | .578 | 76 | -42.8 | .262 | 65 | -41.4 |
| 6 | | T. Wolters | 7 | 1,266 | 407 | 1,103 | 131 | 259 | 48 | 9 | 123 | 127 | 17 | 254 | 6 | 4 | 346 | 64 | 11 | 8 | 18 | 27 | .235 | .321 | .314 | .635 | 112 | -41.9 | .279 | 56 | -70.3 |
| 7 | | J. Mangum | 8 | 907 | 251 | 840 | 93 | 240 | 37 | 3 | 73 | 44 | 14 | 157 | 50 | 15 | 307 | 48 | 6 | 3 | 1 | 11 | .286 | .331 | .365 | .696 | 103 | -4.5 | .309 | 93 | -7.5 |
| 8 | | N. Lopez | 8 | 2,644 | 786 | 2,365 | 287 | 586 | 88 | 19 | 177 | 193 | 28 | 384 | 52 | 22 | 736 | 115 | 51 | 7 | 1 | 35 | .248 | .311 | .311 | .622 | 240 | -77.4 | .279 | 74 | -82.9 |
| 9 | | J. Jay | 8 | 1,645 | 444 | 1,482 | 207 | 411 | 72 | 11 | 114 | 100 | 40 | 297 | 12 | 5 | 529 | 91 | 14 | 9 | 3 | 28 | .277 | .338 | .357 | .695 | 181 | -15.5 | .307 | 89 | -22.9 |
| 10 | | V. Scott II | 9 | 813 | 271 | 709 | 87 | 144 | 28 | 1 | 56 | 64 | 14 | 199 | 51 | 10 | 201 | 38 | 20 | 6 | 0 | 7 | .203 | .280 | .283 | .563 | 59 | -37.4 | .256 | 62 | -36.5 |
| 11 | | N. Aoki | 9 | 840 | 227 | 753 | 111 | 211 | 44 | 6 | 63 | 63 | 12 | 89 | 17 | 11 | 294 | 59 | 6 | 6 | 1 | 21 | .280 | .343 | .390 | .733 | 101 | 0.5 | .320 | 103 | 2.7 |
| 12 | | T. Jankowski | 9 | 1,661 | 672 | 1,462 | 211 | 347 | 52 | 8 | 86 | 172 | 13 | 349 | 102 | 24 | 442 | 69 | 11 | 3 | 4 | 25 | .237 | .322 | .302 | .625 | 153 | -44.5 | .283 | 77 | -45.7 |
| 13 |  | X. Edwards | 10 | 1,601 | 381 | 1,422 | 187 | 414 | 52 | 16 | 124 | 153 | 4 | 237 | 84 | 16 | 528 | 78 | 9 | 13 | 7 | 20 | .291 | .359 | .371 | .730 | 201 | 12.1 | .323 | 104 | 7.7 |
| 14 | | E. Aybar | 10 | 829 | 234 | 748 | 71 | 179 | 34 | 3 | 56 | 59 | 10 | 127 | 14 | 9 | 249 | 47 | 6 | 6 | 8 | 20 | .239 | .301 | .333 | .634 | 69 | -29.9 | .276 | 68 | -32.7 |
| 15 |  | D. Gordon | 10 | 2,189 | 550 | 2,061 | 277 | 578 | 58 | 30 | 122 | 75 | 22 | 310 | 148 | 44 | 726 | 98 | 15 | 16 | 2 | 31 | .280 | .310 | .352 | .663 | 209 | -55.3 | .288 | 81 | -52.5 |
| 16 | | A. Jackson | 10 | 896 | 255 | 808 | 99 | 220 | 48 | 6 | 85 | 76 | 3 | 236 | 8 | 5 | 310 | 64 | 2 | 7 | 2 | 24 | .272 | .334 | .384 | .718 | 103 | -3.1 | .313 | 95 | -5.6 |
| 17 | | J. Mathis | 10 | 874 | 283 | 806 | 63 | 155 | 33 | 5 | 67 | 58 | 3 | 279 | 3 | 0 | 228 | 48 | 3 | 4 | 3 | 16 | .192 | .248 | .283 | .531 | 43 | -63 | .233 | 36 | -70.2 |
| 18 | | G. Allen | 11 | 842 | 311 | 749 | 110 | 170 | 31 | 8 | 68 | 47 | 28 | 199 | 48 | 10 | 250 | 50 | 12 | 6 | 2 | 12 | .227 | .295 | .334 | .629 | 74 | -27.3 | .277 | 71 | -30 |
| 19 | | E. Gonzalez | 11 | 894 | 352 | 842 | 87 | 204 | 41 | 4 | 77 | 38 | 3 | 219 | 13 | 9 | 286 | 56 | 5 | 6 | 3 | 16 | .242 | .276 | .340 | .615 | 70 | -38.8 | .265 | 62 | -43.5 |
| 20 | | R. Torreyes | 11 | 974 | 343 | 911 | 98 | 241 | 40 | 7 | 97 | 42 | 4 | 123 | 7 | 2 | 328 | 58 | 11 | 6 | 2 | 24 | .265 | .298 | .360 | .658 | 91 | -26.5 | .285 | 75 | -30 |
| 21 | | N. Allen | 12 | 1,338 | 476 | 1,215 | 124 | 269 | 39 | 2 | 79 | 82 | 6 | 267 | 18 | 10 | 348 | 53 | 26 | 9 | 0 | 24 | .221 | .272 | .286 | .559 | 89 | -68.7 | .251 | 60 | -62.9 |
| 22 | | Y. Escobar | 12 | 948 | 221 | 867 | 111 | 253 | 48 | 2 | 70 | 69 | 5 | 118 | 1 | 7 | 341 | 62 | 3 | 4 | 0 | 36 | .292 | .346 | .393 | .739 | 116 | 3.1 | .323 | 104 | 4.2 |
| 23 | | G. Garcia | 12 | 1,198 | 515 | 1,007 | 133 | 249 | 42 | 6 | 94 | 155 | 19 | 252 | 7 | 5 | 339 | 60 | 10 | 7 | 6 | 16 | .247 | .356 | .337 | .693 | 137 | -8.4 | .311 | 93 | -9.9 |
| 24 | | N. Loftin | 13 | 853 | 260 | 749 | 84 | 172 | 45 | 5 | 89 | 78 | 11 | 136 | 8 | 2 | 266 | 63 | 6 | 9 | 0 | 17 | .230 | .308 | .355 | .663 | 88 | -13.5 | .295 | 85 | -15.1 |
| 25 | | M. Straw | 13 | 2,609 | 845 | 2,326 | 346 | 572 | 110 | 11 | 183 | 233 | 7 | 445 | 108 | 19 | 743 | 134 | 25 | 18 | 0 | 38 | .246 | .314 | .319 | .634 | 246 | -65.1 | .284 | 80 | -59.5 |
More MLB News
Milwaukee still loves him, but Freddy Peralta will try beating the Brewers in World Series Game 3

Drew Rasmussen can't make it through 4th inning as Rays blow 4-0 lead in Game 2 loss to Brewers

Brewers lefty Aaron Ashby nears postseason scoreless relief record with World Series save
Frelick, Pratt lift Brewers to 5-4 comeback win over Rays and 2-0 World Series lead

At 92, Bud Selig hopes this is the moment he finally sees the Milwaukee Brewers win a title
Balls glancing off gloves, runners thrown out trying to steal sink Rays in World Series opener
More Rays Stats
Team Batting Leaders 


HR
2
Díaz
RBI
8
Hicks
AVG
.320
Palacios
Team Pitching Leaders 

W
2
Rasmussen
K
27
Rasmussen
ERA
0.00
Baker
Team Rankings
HR
169
22nd
R
736
12th
SO
1,322
19th
ERA
3.70
7th
 Orioles
 Blue Jays


MLB 2026 Batting Leaders


MLB 2026 Pitching Leaders


MLB Fantasy 2026
MLB 2026 Betting


MLB 2026 Standings
| NL East | W | L | PCT | GB |
|---|---|---|---|---|
 Braves - y | 94 | 68 | .580 | |
 Phillies - w | 88 | 74 | .543 | 6.0 |
80 | 82 | .494 | 14.0 | |
77 | 85 | .475 | 17.0 | |
74 | 88 | .457 | 20.0 | |
| NL Central | W | L | PCT | GB |
 Brewers - y | 103 | 59 | .636 | |
 Cubs - w | 89 | 73 | .549 | 14.0 |
82 | 80 | .506 | 21.0 | |
77 | 85 | .475 | 26.0 | |
75 | 87 | .463 | 28.0 | |
| NL West | W | L | PCT | GB |
 Dodgers - y | 100 | 62 | .617 | |
 Padres - w | 91 | 71 | .562 | 9.0 |
86 | 76 | .531 | 14.0 | |
65 | 97 | .401 | 35.0 | |
58 | 104 | .358 | 42.0 |
 Marlins
 Nationals
 Mets
 Pirates
 Cardinals
 Reds
 Diamondbacks
 Giants
 Rockies
| AL East | W | L | PCT | GB |
|---|---|---|---|---|
 Rays - y | 98 | 64 | .605 | |
 Yankees - w | 93 | 68 | .578 | 4.5 |
 Red Sox - w | 87 | 75 | .537 | 11.0 |
79 | 82 | .491 | 18.5 | |
79 | 83 | .488 | 19.0 | |
| AL Central | W | L | PCT | GB |
 Guardians - y | 85 | 77 | .525 | |
 White Sox - w | 84 | 78 | .519 | 1.0 |
77 | 85 | .475 | 8.0 | |
76 | 86 | .469 | 9.0 | |
69 | 93 | .426 | 16.0 | |
| AL West | W | L | PCT | GB |
 Astros - y | 81 | 81 | .500 | |
80 | 82 | .494 | 1.0 | |
76 | 86 | .469 | 5.0 | |
64 | 98 | .395 | 17.0 | |
62 | 100 | .383 | 19.0 |
 Twins
 Tigers
 Royals
 Rangers
 Mariners
 Athletics
 Angels