
| NAME | HR | G | AB | R | H | 2B | 3B | RBI | BB | HBP | SO | SB | CS | PA | TB | XBH | SH | SF | IBB | GIDP | AVG | OBP | SLG | OPS | wRC | WRAA | wOBA | wRC+ | BRAA | ||
|---|---|---|---|---|---|---|---|---|---|---|---|---|---|---|---|---|---|---|---|---|---|---|---|---|---|---|---|---|---|---|---|
| 1 |  | C. Jones | 93 | 1,174 | 4,158 | 560 | 1,174 | 181 | 33 | 518 | 352 | 39 | 687 | 91 | 48 | 4,615 | 1,700 | 307 | 25 | 41 | 42 | 107 | .282 | .341 | .409 | .750 | 578 | 97.1 | .337 | 113 | 66.7 |
| 2 | | T. Agee | 82 | 661 | 2,416 | 344 | 632 | 107 | 14 | 265 | 232 | 15 | 572 | 92 | 47 | 2,687 | 1,013 | 203 | 15 | 9 | 16 | 54 | .262 | .329 | .419 | .748 | 338 | 58.7 | .338 | 112 | 38.7 |
| 3 | | E. Kranepool | 77 | 1,160 | 3,480 | 336 | 894 | 136 | 18 | 387 | 298 | 10 | 371 | 8 | 18 | 3,848 | 1,297 | 231 | 29 | 31 | 66 | 77 | .257 | .315 | .373 | .687 | 398 | 0.6 | .306 | 94 | -25.7 |
| 4 | | R. Swoboda | 69 | 737 | 2,212 | 246 | 536 | 73 | 20 | 304 | 240 | 16 | 549 | 20 | 12 | 2,485 | 856 | 162 | 6 | 11 | 16 | 57 | .242 | .319 | .387 | .706 | 283 | 27.8 | .319 | 103 | 7.9 |
| 5 | | J. Milner | 60 | 392 | 1,338 | 192 | 325 | 44 | 5 | 174 | 179 | 6 | 238 | 13 | 4 | 1,536 | 559 | 109 | 5 | 8 | 16 | 41 | .243 | .333 | .418 | .751 | 193 | 30.3 | .341 | 114 | 24.5 |
| 6 | | D. Clendenon | 45 | 281 | 861 | 125 | 230 | 33 | 3 | 171 | 79 | 4 | 231 | 8 | 5 | 957 | 404 | 81 | 2 | 11 | 11 | 30 | .267 | .328 | .469 | .797 | 131 | 27 | .352 | 117 | 20.2 |
| 7 | | W. Garrett | 45 | 696 | 2,292 | 304 | 538 | 77 | 16 | 235 | 380 | 9 | 394 | 23 | 19 | 2,728 | 782 | 138 | 28 | 19 | 25 | 34 | .235 | .343 | .341 | .685 | 298 | 5.7 | .317 | 97 | -7.8 |
| 8 | | R. Staub | 43 | 369 | 1,385 | 174 | 378 | 69 | 3 | 192 | 182 | 8 | 104 | 3 | 3 | 1,593 | 582 | 115 | 3 | 15 | 29 | 42 | .273 | .357 | .420 | .777 | 211 | 40.3 | .350 | 120 | 35.6 |
| 9 | | A. Shamsky | 42 | 406 | 1,186 | 133 | 316 | 48 | 11 | 162 | 127 | 14 | 141 | 4 | 4 | 1,345 | 512 | 101 | 6 | 12 | 23 | 28 | .266 | .341 | .432 | .773 | 176 | 36.2 | .345 | 117 | 26.4 |
| 10 | | K. Boswell | 31 | 681 | 2,116 | 231 | 528 | 74 | 15 | 193 | 192 | 8 | 207 | 26 | 14 | 2,359 | 725 | 120 | 24 | 19 | 19 | 70 | .250 | .312 | .343 | .654 | 226 | -19.5 | .299 | 87 | -34.8 |
| 11 | | J. Grote | 29 | 973 | 3,057 | 248 | 761 | 112 | 10 | 283 | 278 | 17 | 455 | 13 | 17 | 3,413 | 980 | 151 | 39 | 22 | 57 | 90 | .249 | .313 | .321 | .634 | 299 | -56.6 | .286 | 80 | -78.8 |
| 12 | | E. Charles | 21 | 279 | 861 | 94 | 214 | 32 | 4 | 102 | 70 | 10 | 146 | 13 | 7 | 963 | 317 | 57 | 11 | 11 | 8 | 18 | .249 | .309 | .368 | .677 | 99 | 5.1 | .307 | 99 | -2.2 |
| 13 | | J. Lewis | 20 | 226 | 677 | 87 | 153 | 22 | 4 | 67 | 82 | 3 | 171 | 6 | 7 | 768 | 243 | 46 | 4 | 2 | 4 | 9 | .226 | .312 | .359 | .670 | 81 | -0.2 | .303 | 93 | -6.5 |
| 14 | | J. Hickman | 19 | 199 | 529 | 47 | 125 | 25 | 0 | 56 | 40 | 3 | 110 | 5 | 2 | 574 | 207 | 44 | 1 | 1 | 3 | 13 | .236 | .293 | .391 | .684 | 61 | 0.4 | .305 | 93 | -4.4 |
| 15 | | K. Singleton | 18 | 184 | 496 | 56 | 125 | 13 | 0 | 72 | 91 | 3 | 112 | 1 | 2 | 600 | 192 | 31 | 6 | 4 | 10 | 17 | .252 | .369 | .387 | .756 | 78 | 13.8 | .345 | 115 | 9.9 |
| 16 | | K. Boyer | 17 | 192 | 662 | 79 | 171 | 35 | 4 | 74 | 56 | 0 | 86 | 6 | 4 | 728 | 265 | 56 | 1 | 9 | 8 | 21 | .258 | .312 | .400 | .713 | 82 | 5.7 | .313 | 99 | -1.3 |
| 17 | | D. Dyer | 16 | 375 | 1,050 | 82 | 230 | 35 | 7 | 97 | 99 | 9 | 226 | 2 | 3 | 1,167 | 327 | 58 | 4 | 5 | 20 | 31 | .219 | .291 | .311 | .602 | 89 | -33.3 | .274 | 70 | -40.3 |
| 18 | | T. Davis | 16 | 154 | 577 | 72 | 174 | 32 | 0 | 73 | 31 | 7 | 71 | 9 | 3 | 621 | 254 | 48 | 1 | 5 | 10 | 16 | .302 | .342 | .440 | .782 | 83 | 21.2 | .346 | 123 | 15.8 |
| 19 | | C. Smith | 16 | 135 | 499 | 49 | 122 | 20 | 3 | 62 | 17 | 4 | 123 | 2 | 1 | 531 | 196 | 39 | 7 | 4 | 3 | 13 | .244 | .273 | .393 | .666 | 52 | -4.4 | .293 | 86 | -8.5 |
| 20 | | J. Buchek | 15 | 197 | 603 | 43 | 132 | 15 | 2 | 52 | 36 | 5 | 154 | 4 | 6 | 651 | 196 | 32 | 5 | 2 | 10 | 18 | .219 | .268 | .325 | .593 | 49 | -14 | .265 | 71 | -19.4 |
| 21 |  | W. Mays | 14 | 135 | 404 | 51 | 96 | 19 | 1 | 44 | 70 | 2 | 90 | 2 | 5 | 481 | 159 | 34 | 4 | 1 | 5 | 12 | .238 | .352 | .394 | .746 | 61 | 10.7 | .342 | 116 | 8 |
| 22 | | D. Marshall | 13 | 264 | 559 | 70 | 136 | 24 | 2 | 61 | 65 | 3 | 125 | 10 | 5 | 637 | 203 | 39 | 6 | 4 | 4 | 14 | .243 | .323 | .363 | .686 | 68 | 1 | .314 | 95 | -3.8 |
| 23 | | E. Bressoud | 10 | 133 | 405 | 48 | 91 | 15 | 5 | 49 | 47 | 1 | 107 | 2 | 2 | 464 | 146 | 30 | 7 | 4 | 4 | 11 | .225 | .304 | .360 | .665 | 46 | -2.8 | .295 | 86 | -7.3 |
| 24 | | A. Luplow | 10 | 152 | 446 | 42 | 107 | 10 | 1 | 40 | 46 | 3 | 65 | 2 | 6 | 500 | 149 | 21 | 2 | 3 | 4 | 13 | .240 | .313 | .334 | .647 | 49 | -3.6 | .292 | 85 | -8.4 |
| 25 | | D. Schneck | 8 | 143 | 413 | 32 | 82 | 14 | 4 | 35 | 27 | 2 | 73 | 4 | 2 | 443 | 128 | 26 | 0 | 1 | 5 | 5 | .199 | .251 | .310 | .560 | 27 | -19.2 | .255 | 58 | -20.9 |
More MLB News
Orioles introduce new GM Jared Banner, who takes over player development

Phillies name Pete Fatse their hitting coach, hire Joe Cronin as assistant hitting coach
Brewers' Robert Gasser spins World Series gem unlike any by a lefty since Sandy Koufax

Brewers rout the Rays 10-1 to move within a win of their first World Series title
Rays put on the brink of World Series flop by Brewers' historic 8-run, 2-out surge

Roberto Clemente Award List
More Mets Stats
Team Batting Leaders 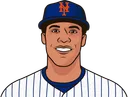


HR
27
Soto
RBI
78
Bichette
AVG
.282
Benge
Team Pitching Leaders 
W
12
McLean
K
194
McLean
ERA
3.16
McLean
Team Rankings
HR
204
7th
R
699
20th
SO
1,450
6th
ERA
4.15
17th
 Marlins
 Nationals
 Mets


MLB 2026 Batting Leaders


MLB 2026 Pitching Leaders


MLB Fantasy 2026
MLB 2026 Betting


MLB 2026 Standings
| NL East | W | L | PCT | GB |
|---|---|---|---|---|
 Braves - y | 94 | 68 | .580 | |
 Phillies - w | 88 | 74 | .543 | 6.0 |
80 | 82 | .494 | 14.0 | |
77 | 85 | .475 | 17.0 | |
74 | 88 | .457 | 20.0 | |
| NL Central | W | L | PCT | GB |
 Brewers - y | 103 | 59 | .636 | |
 Cubs - w | 89 | 73 | .549 | 14.0 |
82 | 80 | .506 | 21.0 | |
77 | 85 | .475 | 26.0 | |
75 | 87 | .463 | 28.0 | |
| NL West | W | L | PCT | GB |
 Dodgers - y | 100 | 62 | .617 | |
 Padres - w | 91 | 71 | .562 | 9.0 |
86 | 76 | .531 | 14.0 | |
65 | 97 | .401 | 35.0 | |
58 | 104 | .358 | 42.0 |
 Pirates
 Cardinals
 Reds
 Diamondbacks
 Giants
 Rockies
| AL East | W | L | PCT | GB |
|---|---|---|---|---|
 Rays - y | 98 | 64 | .605 | |
 Yankees - w | 93 | 68 | .578 | 4.5 |
 Red Sox - w | 87 | 75 | .537 | 11.0 |
79 | 82 | .491 | 18.5 | |
79 | 83 | .488 | 19.0 | |
| AL Central | W | L | PCT | GB |
 Guardians - y | 85 | 77 | .525 | |
 White Sox - w | 84 | 78 | .519 | 1.0 |
77 | 85 | .475 | 8.0 | |
76 | 86 | .469 | 9.0 | |
69 | 93 | .426 | 16.0 | |
| AL West | W | L | PCT | GB |
 Astros - y | 81 | 81 | .500 | |
80 | 82 | .494 | 1.0 | |
76 | 86 | .469 | 5.0 | |
64 | 98 | .395 | 17.0 | |
62 | 100 | .383 | 19.0 |
 Orioles
 Blue Jays
 Twins
 Tigers
 Royals
 Rangers
 Mariners
 Athletics
 Angels