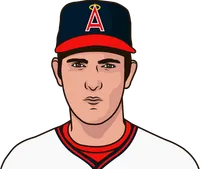
Nolan Ryan had the most games pitched when striking out 10+ batters with 1+ walk allowed, with 207 games.
Showing
| NAME | G | SO | BB | W | L | W% | GS | ERA | CG | SHO | SV | IP | H | ER | R | HR | HBP | GF | IBB | TBF | WP | K/9 | BB/9 | K/BB | HR/9 | K% | BB% | WHIP | BABIP | RA | H/9 | ||
|---|---|---|---|---|---|---|---|---|---|---|---|---|---|---|---|---|---|---|---|---|---|---|---|---|---|---|---|---|---|---|---|---|---|
| 1 |  | N. Ryan | 207 | 2,451 | 827 | 125 | 54 | .698 | 207 | 1.86 | 124 | 41 | 0 | 1740.1 | 993 | 360 | 422 | 70 | 46 | 0 | 25 | 6,973 | 90 | 12.68 | 4.28 | 2.96 | 0.36 | 35.1 | 11.9 | 1.05 | .258 | 2.18 | 5.14 |
| 2 |  | R. Johnson | 176 | 2,117 | 437 | 111 | 33 | .771 | 175 | 2.15 | 52 | 20 | 0 | 1363.2 | 894 | 326 | 367 | 105 | 48 | 1 | 12 | 5,375 | 34 | 13.97 | 2.88 | 4.84 | 0.69 | 39.4 | 8.1 | 0.98 | .296 | 2.42 | 5.90 |
| 3 |  | P. Martinez | 90 | 1,021 | 177 | 53 | 17 | .757 | 90 | 1.75 | 21 | 5 | 0 | 683.0 | 425 | 133 | 150 | 45 | 23 | 0 | 9 | 2,643 | 11 | 13.45 | 2.33 | 5.77 | 0.59 | 38.6 | 6.7 | 0.88 | .276 | 1.98 | 5.60 |
| 4 |  | S. Koufax | 90 | 1,048 | 240 | 69 | 14 | .831 | 90 | 1.70 | 67 | 13 | 0 | 801.2 | 467 | 151 | 172 | 55 | 4 | 0 | 15 | 3,098 | 24 | 11.77 | 2.69 | 4.37 | 0.62 | 33.8 | 7.7 | 0.88 | .235 | 1.93 | 5.24 |
| 5 |  | R. Clemens | 89 | 989 | 187 | 63 | 10 | .863 | 89 | 1.58 | 33 | 16 | 0 | 714.0 | 456 | 125 | 138 | 31 | 11 | 0 | 4 | 2,756 | 14 | 12.47 | 2.36 | 5.29 | 0.39 | 35.9 | 6.8 | 0.90 | .276 | 1.74 | 5.75 |
| 6 |  | M. Scherzer | 84 | 926 | 145 | 44 | 17 | .721 | 84 | 2.01 | 3 | 1 | 0 | 579.0 | 333 | 129 | 139 | 59 | 19 | 0 | 3 | 2,221 | 15 | 14.39 | 2.25 | 6.39 | 0.92 | 41.7 | 6.5 | 0.83 | .256 | 2.16 | 5.18 |
| 7 |  | S. Carlton | 77 | 890 | 240 | 50 | 18 | .735 | 77 | 2.15 | 48 | 10 | 0 | 656.0 | 482 | 157 | 173 | 35 | 6 | 0 | 24 | 2,648 | 28 | 12.21 | 3.29 | 3.71 | 0.48 | 33.6 | 9.1 | 1.10 | .303 | 2.37 | 6.61 |
| 8 |  | C. Sale | 74 | 829 | 123 | 37 | 17 | .685 | 74 | 1.95 | 4 | 0 | 0 | 515.2 | 337 | 112 | 125 | 34 | 27 | 0 | 2 | 2,018 | 12 | 14.47 | 2.15 | 6.74 | 0.59 | 41.1 | 6.1 | 0.89 | .301 | 2.18 | 5.88 |
| 9 |  | S. McDowell | 71 | 820 | 267 | 42 | 14 | .750 | 71 | 1.74 | 42 | 11 | 0 | 611.1 | 369 | 118 | 143 | 21 | 13 | 1 | 10 | 2,450 | 20 | 12.07 | 3.93 | 3.07 | 0.31 | 33.5 | 10.9 | 1.04 | .262 | 2.11 | 5.43 |
| 10 | | C. Schilling | 66 | 756 | 110 | 40 | 17 | .702 | 66 | 2.32 | 17 | 4 | 0 | 504.0 | 352 | 130 | 139 | 43 | 6 | 0 | 4 | 1,957 | 10 | 13.50 | 1.96 | 6.87 | 0.77 | 38.6 | 5.6 | 0.92 | .297 | 2.48 | 6.29 |
| 11 |  | B. Gibson | 65 | 740 | 154 | 47 | 15 | .758 | 65 | 1.74 | 54 | 12 | 0 | 596.0 | 405 | 115 | 137 | 25 | 15 | 0 | 14 | 2,331 | 11 | 11.17 | 2.33 | 4.81 | 0.38 | 31.7 | 6.6 | 0.94 | .272 | 2.07 | 6.12 |
| 12 |  | T. Seaver | 59 | 685 | 137 | 41 | 9 | .820 | 59 | 1.60 | 37 | 13 | 0 | 523.0 | 319 | 93 | 98 | 35 | 7 | 0 | 11 | 2,004 | 8 | 11.79 | 2.36 | 5.00 | 0.60 | 34.2 | 6.8 | 0.87 | .249 | 1.69 | 5.49 |
| 13 |  | J. Verlander | 53 | 589 | 93 | 37 | 6 | .860 | 53 | 1.68 | 6 | 5 | 0 | 374.0 | 234 | 70 | 74 | 22 | 8 | 0 | 3 | 1,442 | 11 | 14.17 | 2.24 | 6.33 | 0.53 | 40.8 | 6.4 | 0.87 | .290 | 1.78 | 5.63 |
| 14 | | D. Cone | 50 | 564 | 137 | 29 | 10 | .744 | 50 | 2.25 | 11 | 7 | 0 | 388.0 | 266 | 97 | 107 | 32 | 12 | 0 | 6 | 1,557 | 20 | 13.08 | 3.18 | 4.12 | 0.74 | 36.2 | 8.8 | 1.04 | .288 | 2.48 | 6.17 |
| 15 | | M. Lolich | 49 | 554 | 138 | 31 | 10 | .756 | 49 | 1.92 | 34 | 9 | 0 | 431.1 | 311 | 92 | 106 | 27 | 18 | 0 | 4 | 1,735 | 15 | 11.56 | 2.88 | 4.01 | 0.56 | 31.9 | 8.0 | 1.04 | .285 | 2.21 | 6.49 |
| 16 | | B. Feller | 49 | 567 | 219 | 40 | 7 | .851 | 49 | 1.69 | 44 | 12 | 0 | 442.1 | 274 | 83 | 94 | 8 | 6 | 0 | 1,808 | 10 | 11.54 | 4.46 | 2.59 | 0.16 | 31.4 | 12.1 | 1.11 | .264 | 1.91 | 5.57 | |
| 17 |  | J. deGrom | 47 | 519 | 83 | 23 | 7 | .767 | 47 | 1.90 | 0 | 0 | 0 | 313.1 | 197 | 66 | 77 | 23 | 1 | 0 | 4 | 1,204 | 9 | 14.91 | 2.38 | 6.25 | 0.66 | 43.1 | 6.9 | 0.89 | .301 | 2.21 | 5.66 |
| 18 | | B. Blyleven | 44 | 498 | 87 | 28 | 11 | .718 | 44 | 1.50 | 32 | 6 | 0 | 383.1 | 261 | 64 | 84 | 14 | 10 | 0 | 4 | 1,492 | 10 | 11.69 | 2.04 | 5.72 | 0.33 | 33.4 | 5.8 | 0.91 | .280 | 1.97 | 6.13 |
| 19 | | J. Bunning | 44 | 474 | 94 | 26 | 6 | .813 | 44 | 1.67 | 22 | 4 | 0 | 387.0 | 280 | 72 | 86 | 25 | 14 | 0 | 6 | 1,531 | 2 | 11.02 | 2.19 | 5.04 | 0.58 | 31.0 | 6.1 | 0.97 | .276 | 2.00 | 6.51 |
| 20 | | M. Langston | 43 | 487 | 124 | 26 | 8 | .765 | 43 | 2.14 | 21 | 4 | 0 | 366.1 | 255 | 87 | 97 | 23 | 3 | 0 | 2 | 1,453 | 9 | 11.96 | 3.05 | 3.93 | 0.57 | 33.5 | 8.5 | 1.03 | .284 | 2.38 | 6.26 |
| 21 |  | C. Kershaw | 41 | 459 | 64 | 28 | 5 | .848 | 41 | 1.62 | 6 | 4 | 0 | 300.2 | 165 | 54 | 60 | 23 | 3 | 0 | 1 | 1,116 | 6 | 13.74 | 1.92 | 7.17 | 0.69 | 41.1 | 5.7 | 0.76 | .250 | 1.80 | 4.94 |
| 22 | | J. Santana | 41 | 454 | 68 | 26 | 8 | .765 | 41 | 1.95 | 3 | 2 | 0 | 299.2 | 182 | 65 | 68 | 30 | 5 | 0 | 0 | 1,143 | 7 | 13.64 | 2.04 | 6.68 | 0.90 | 39.7 | 5.9 | 0.83 | .259 | 2.04 | 5.47 |
| 23 |  | G. Cole | 40 | 446 | 70 | 21 | 4 | .840 | 40 | 2.03 | 4 | 3 | 0 | 266.0 | 157 | 60 | 68 | 29 | 5 | 0 | 1 | 1,015 | 9 | 15.09 | 2.37 | 6.37 | 0.98 | 43.9 | 6.9 | 0.85 | .275 | 2.30 | 5.31 |
| 24 | | D. Gooden | 40 | 448 | 101 | 28 | 5 | .848 | 40 | 1.54 | 18 | 9 | 0 | 333.1 | 205 | 57 | 62 | 15 | 4 | 0 | 5 | 1,286 | 9 | 12.10 | 2.73 | 4.44 | 0.41 | 34.8 | 7.9 | 0.92 | .265 | 1.67 | 5.53 |
| 25 |  | Y. Darvish | 39 | 433 | 79 | 23 | 11 | .676 | 39 | 1.89 | 1 | 1 | 0 | 271.2 | 165 | 57 | 60 | 26 | 6 | 0 | 1 | 1,052 | 9 | 14.34 | 2.62 | 5.48 | 0.86 | 41.2 | 7.5 | 0.90 | .274 | 1.99 | 5.47 |
More MLB News
White Sox announce deal with Dustin May and designate Jordan Leasure for assignment
Red Sox acquire catcher Nick Fortes in a trade with the division rival Rays
MLB Commissioner Rob Manfred expects $4 billion Angels sale to Kroenke to close in January
Twins sign pitcher Sonny Gray to $55 million, 2-year deal after his 18-win season with Red Sox

Rob Manfred says MLB owners won't compromise on a salary cap, leaving sport headed to a lockout
Angels acquire infielder Jace Jung in a trade with the Tigers for cash
More Angels Stats
Team Batting Leaders 

HR
27
Neto
RBI
77
Neto
AVG
.300
Meckler
Team Pitching Leaders 
W
9
Soriano
K
211
Detmers
ERA
2.97
Ureña
Team Rankings
HR
154
28th
R
655
29th
SO
1,439
8th
ERA
4.29
21st
 Rangers
 Mariners
 Athletics
 Angels


MLB 2026 Batting Leaders


MLB 2026 Pitching Leaders


MLB Fantasy 2026

MLB 2026 Betting


MLB 2026 Standings
| NL East | W | L | PCT | GB |
|---|---|---|---|---|
 Braves - y | 94 | 68 | .580 | |
 Phillies - w | 88 | 74 | .543 | 6.0 |
80 | 82 | .494 | 14.0 | |
77 | 85 | .475 | 17.0 | |
74 | 88 | .457 | 20.0 | |
| NL Central | W | L | PCT | GB |
 Brewers - y | 103 | 59 | .636 | |
 Cubs - w | 89 | 73 | .549 | 14.0 |
82 | 80 | .506 | 21.0 | |
77 | 85 | .475 | 26.0 | |
75 | 87 | .463 | 28.0 | |
| NL West | W | L | PCT | GB |
 Dodgers - y | 100 | 62 | .617 | |
 Padres - w | 91 | 71 | .562 | 9.0 |
86 | 76 | .531 | 14.0 | |
65 | 97 | .401 | 35.0 | |
58 | 104 | .358 | 42.0 |
 Marlins
 Nationals
 Mets
 Pirates
 Cardinals
 Reds
 Diamondbacks
 Giants
 Rockies
| AL East | W | L | PCT | GB |
|---|---|---|---|---|
 Rays - y | 98 | 64 | .605 | |
 Yankees - w | 93 | 68 | .578 | 4.5 |
 Red Sox - w | 87 | 75 | .537 | 11.0 |
79 | 82 | .491 | 18.5 | |
79 | 83 | .488 | 19.0 | |
| AL Central | W | L | PCT | GB |
 Guardians - y | 85 | 77 | .525 | |
 White Sox - w | 84 | 78 | .519 | 1.0 |
77 | 85 | .475 | 8.0 | |
76 | 86 | .469 | 9.0 | |
69 | 93 | .426 | 16.0 | |
| AL West | W | L | PCT | GB |
 Astros - y | 81 | 81 | .500 | |
80 | 82 | .494 | 1.0 | |
76 | 86 | .469 | 5.0 | |
64 | 98 | .395 | 17.0 | |
62 | 100 | .383 | 19.0 |
 Orioles
 Blue Jays
 Twins
 Tigers
 Royals