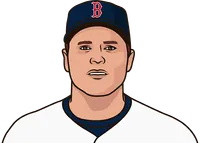
Between June 4, 1980 and July 14, 2005, Roger Clemens struck out the most hitters, with 4,429 strikeouts.
Showing
| NAME | SO | G | W | L | W% | GS | ERA | CG | SHO | SV | IP | H | ER | R | HR | BB | HBP | GF | IBB | TBF | WP | K/9 | BB/9 | K/BB | HR/9 | K% | BB% | WHIP | BABIP | RA | H/9 | ||
|---|---|---|---|---|---|---|---|---|---|---|---|---|---|---|---|---|---|---|---|---|---|---|---|---|---|---|---|---|---|---|---|---|---|
| 1 |  | R. Clemens | 4,429 | 658 | 335 | 167 | .667 | 657 | 3.14 | 117 | 46 | 0 | 4615.0 | 3,928 | 1,608 | 1,770 | 341 | 1,492 | 148 | 0 | 59 | 19,008 | 131 | 8.64 | 2.91 | 2.97 | 0.67 | 23.3 | 7.8 | 1.17 | .285 | 3.45 | 7.66 |
| 2 |  | R. Johnson | 4,278 | 508 | 255 | 134 | .656 | 498 | 3.11 | 95 | 37 | 2 | 3495.2 | 2,745 | 1,207 | 1,368 | 320 | 1,326 | 162 | 5 | 24 | 14,398 | 98 | 11.01 | 3.41 | 3.23 | 0.82 | 29.7 | 9.2 | 1.16 | .292 | 3.52 | 7.07 |
| 3 |  | G. Maddux | 2,988 | 627 | 313 | 180 | .635 | 623 | 3.00 | 105 | 35 | 0 | 4297.0 | 3,971 | 1,430 | 1,626 | 285 | 891 | 122 | 3 | 161 | 17,477 | 61 | 6.26 | 1.87 | 3.35 | 0.60 | 17.1 | 5.1 | 1.13 | .279 | 3.41 | 8.32 |
| 4 |  | P. Martinez | 2,791 | 406 | 192 | 79 | .708 | 339 | 2.71 | 44 | 16 | 3 | 2425.0 | 1,831 | 730 | 806 | 184 | 639 | 117 | 23 | 21 | 9,680 | 57 | 10.36 | 2.37 | 4.37 | 0.68 | 28.8 | 6.6 | 1.02 | .277 | 2.99 | 6.80 |
| 5 |  | C. Schilling | 2,766 | 486 | 185 | 126 | .595 | 373 | 3.36 | 82 | 19 | 13 | 2831.1 | 2,523 | 1,057 | 1,119 | 290 | 641 | 46 | 61 | 41 | 11,489 | 70 | 8.79 | 2.04 | 4.32 | 0.92 | 24.1 | 5.6 | 1.12 | .288 | 3.56 | 8.02 |
| 6 |  | N. Ryan | 2,743 | 400 | 154 | 128 | .546 | 400 | 3.23 | 51 | 17 | 0 | 2618.2 | 1,975 | 940 | 1,074 | 168 | 1,103 | 78 | 0 | 35 | 10,852 | 148 | 9.43 | 3.79 | 2.49 | 0.58 | 25.3 | 10.2 | 1.18 | .267 | 3.69 | 6.79 |
| 7 | | D. Cone | 2,668 | 450 | 194 | 126 | .606 | 419 | 3.47 | 56 | 22 | 1 | 2898.2 | 2,504 | 1,116 | 1,222 | 258 | 1,137 | 106 | 9 | 42 | 12,184 | 149 | 8.28 | 3.53 | 2.35 | 0.80 | 21.9 | 9.3 | 1.26 | .280 | 3.79 | 7.77 |
| 8 | | C. Finley | 2,610 | 524 | 200 | 173 | .536 | 467 | 3.85 | 63 | 15 | 0 | 3197.1 | 3,069 | 1,366 | 1,517 | 304 | 1,332 | 76 | 24 | 36 | 13,638 | 130 | 7.35 | 3.75 | 1.96 | 0.86 | 19.1 | 9.8 | 1.38 | .297 | 4.27 | 8.64 |
| 9 |  | J. Smoltz | 2,496 | 621 | 172 | 126 | .577 | 380 | 3.25 | 50 | 15 | 154 | 2831.0 | 2,447 | 1,023 | 1,119 | 224 | 865 | 40 | 204 | 65 | 11,606 | 129 | 7.94 | 2.75 | 2.89 | 0.71 | 21.5 | 7.5 | 1.17 | .279 | 3.56 | 7.78 |
| 10 | | M. Langston | 2,464 | 457 | 179 | 158 | .531 | 428 | 3.97 | 81 | 18 | 0 | 2962.2 | 2,723 | 1,306 | 1,438 | 311 | 1,289 | 46 | 3 | 34 | 12,562 | 89 | 7.49 | 3.92 | 1.91 | 0.94 | 19.6 | 10.3 | 1.35 | .285 | 4.37 | 8.27 |
| 11 | | K. Brown | 2,392 | 484 | 211 | 143 | .596 | 474 | 3.25 | 72 | 17 | 0 | 3248.2 | 3,063 | 1,172 | 1,344 | 205 | 897 | 138 | 1 | 42 | 13,500 | 108 | 6.63 | 2.49 | 2.67 | 0.57 | 17.7 | 6.6 | 1.22 | .290 | 3.72 | 8.49 |
| 12 | | M. Mussina | 2,344 | 432 | 220 | 124 | .640 | 432 | 3.62 | 56 | 23 | 0 | 2952.2 | 2,804 | 1,186 | 1,262 | 316 | 667 | 40 | 0 | 23 | 12,054 | 63 | 7.14 | 2.03 | 3.51 | 0.96 | 19.4 | 5.5 | 1.18 | .286 | 3.85 | 8.55 |
| 13 | | D. Gooden | 2,293 | 430 | 194 | 112 | .634 | 410 | 3.51 | 68 | 24 | 3 | 2800.2 | 2,564 | 1,091 | 1,198 | 210 | 954 | 78 | 4 | 42 | 11,705 | 76 | 7.37 | 3.07 | 2.40 | 0.67 | 19.6 | 8.2 | 1.26 | .288 | 3.85 | 8.24 |
| 14 | | T. Glavine | 2,291 | 588 | 268 | 178 | .601 | 588 | 3.48 | 53 | 23 | 0 | 3842.1 | 3,720 | 1,485 | 1,635 | 295 | 1,317 | 54 | 0 | 128 | 16,199 | 62 | 5.37 | 3.08 | 1.74 | 0.69 | 14.1 | 8.1 | 1.31 | .280 | 3.83 | 8.71 |
| 15 |  | J. Morris | 2,249 | 475 | 228 | 168 | .576 | 475 | 3.91 | 163 | 27 | 0 | 3388.1 | 3,162 | 1,473 | 1,618 | 352 | 1,235 | 50 | 0 | 90 | 14,301 | 189 | 5.97 | 3.28 | 1.82 | 0.93 | 15.7 | 8.6 | 1.30 | .270 | 4.30 | 8.40 |
| 16 | | F. Valenzuela | 2,074 | 453 | 173 | 153 | .531 | 424 | 3.54 | 113 | 31 | 2 | 2930.0 | 2,718 | 1,154 | 1,303 | 226 | 1,151 | 25 | 10 | 65 | 12,398 | 119 | 6.37 | 3.54 | 1.80 | 0.69 | 16.7 | 9.3 | 1.32 | .279 | 4.00 | 8.35 |
| 17 | | D. Wells | 2,023 | 603 | 218 | 141 | .607 | 432 | 4.06 | 53 | 12 | 13 | 3112.1 | 3,223 | 1,405 | 1,519 | 366 | 655 | 76 | 65 | 60 | 12,995 | 96 | 5.85 | 1.89 | 3.09 | 1.06 | 15.6 | 5.0 | 1.25 | .289 | 4.39 | 9.32 |
| 18 | | O. Hershiser | 2,014 | 510 | 204 | 150 | .576 | 466 | 3.48 | 68 | 25 | 5 | 3130.1 | 2,939 | 1,211 | 1,367 | 235 | 1,007 | 117 | 19 | 108 | 13,150 | 121 | 5.79 | 2.90 | 2.00 | 0.68 | 15.3 | 7.7 | 1.26 | .277 | 3.93 | 8.45 |
| 19 | | A. Benes | 2,000 | 403 | 155 | 139 | .527 | 387 | 3.97 | 21 | 9 | 1 | 2505.1 | 2,377 | 1,106 | 1,206 | 289 | 909 | 55 | 6 | 52 | 10,645 | 63 | 7.18 | 3.27 | 2.20 | 1.04 | 18.8 | 8.5 | 1.31 | .282 | 4.33 | 8.54 |
| 20 | | K. Appier | 1,994 | 414 | 169 | 137 | .552 | 402 | 3.74 | 34 | 12 | 0 | 2595.1 | 2,425 | 1,078 | 1,168 | 232 | 933 | 79 | 2 | 51 | 10,958 | 106 | 6.91 | 3.24 | 2.14 | 0.80 | 18.2 | 8.5 | 1.29 | .284 | 4.05 | 8.41 |
| 21 | | B. Witt | 1,955 | 430 | 142 | 157 | .475 | 397 | 4.83 | 47 | 11 | 0 | 2465.0 | 2,493 | 1,324 | 1,449 | 252 | 1,375 | 39 | 13 | 37 | 11,003 | 128 | 7.14 | 5.02 | 1.42 | 0.92 | 17.8 | 12.5 | 1.57 | .304 | 5.29 | 9.10 |
| 22 | | A. Leiter | 1,929 | 403 | 158 | 127 | .554 | 372 | 3.76 | 16 | 10 | 2 | 2328.2 | 2,086 | 972 | 1,059 | 194 | 1,125 | 111 | 7 | 53 | 10,041 | 61 | 7.46 | 4.35 | 1.71 | 0.75 | 19.2 | 11.2 | 1.38 | .283 | 4.09 | 8.06 |
| 23 | | H. Nomo | 1,910 | 319 | 123 | 108 | .532 | 317 | 4.19 | 16 | 9 | 0 | 1969.1 | 1,750 | 916 | 977 | 247 | 901 | 38 | 0 | 31 | 8,416 | 109 | 8.73 | 4.12 | 2.12 | 1.13 | 22.7 | 10.7 | 1.35 | .283 | 4.46 | 8.00 |
| 24 | | F. Viola | 1,844 | 421 | 176 | 150 | .540 | 420 | 3.73 | 74 | 16 | 0 | 2836.1 | 2,827 | 1,175 | 1,303 | 294 | 864 | 48 | 0 | 39 | 11,933 | 86 | 5.85 | 2.74 | 2.13 | 0.93 | 15.5 | 7.2 | 1.30 | .285 | 4.13 | 8.97 |
| 25 | | D. Darwin | 1,839 | 680 | 162 | 177 | .478 | 362 | 3.86 | 52 | 9 | 32 | 2887.2 | 2,847 | 1,237 | 1,379 | 316 | 824 | 75 | 161 | 97 | 12,189 | 52 | 5.73 | 2.57 | 2.23 | 0.98 | 15.1 | 6.8 | 1.27 | .277 | 4.30 | 8.87 |
More MLB News
Braves exercise options on Ronald Acuña Jr. and Ozzie Albies
Mariners exercise Andrés Muñoz's $9 million option, decline options on Victor Robles, Bryce Miller

MLB's 2027 season threatened with lockout looming when labor deal expires Dec. 1
Tampa Bay Rays proved their brand of baseball can overcome a low payroll

MLB Free Agents List
Reliever Ryan Helsley intends to pick up his $14 million option with Baltimore, AP source says
More Red Sox Stats
Team Batting Leaders 

HR
1
Contreras
RBI
1
Contreras
AVG
.500
Eaton
Team Pitching Leaders 

K
5
Gray
ERA
0.00
Chapman
Team Rankings
HR
163
26th
R
689
23rd
SO
1,398
11th
ERA
3.54
3rd
 Orioles
 Blue Jays
 SEA


MLB 2026 Batting Leaders


MLB 2026 Pitching Leaders


MLB Fantasy 2026
MLB 2026 Betting


MLB 2026 Standings
| NL East | W | L | PCT | GB |
|---|---|---|---|---|
 Braves - y | 94 | 68 | .580 | |
 Phillies - w | 88 | 74 | .543 | 6.0 |
80 | 82 | .494 | 14.0 | |
77 | 85 | .475 | 17.0 | |
74 | 88 | .457 | 20.0 | |
| NL Central | W | L | PCT | GB |
 Brewers - y | 103 | 59 | .636 | |
 Cubs - w | 89 | 73 | .549 | 14.0 |
82 | 80 | .506 | 21.0 | |
77 | 85 | .475 | 26.0 | |
75 | 87 | .463 | 28.0 | |
| NL West | W | L | PCT | GB |
 Dodgers - y | 100 | 62 | .617 | |
 Padres - w | 91 | 71 | .562 | 9.0 |
86 | 76 | .531 | 14.0 | |
65 | 97 | .401 | 35.0 | |
58 | 104 | .358 | 42.0 |
 Marlins
 Nationals
 Mets
 Pirates
 Cardinals
 Reds
 Diamondbacks
 Giants
 Rockies
| AL East | W | L | PCT | GB |
|---|---|---|---|---|
 Rays - y | 98 | 64 | .605 | |
 Yankees - w | 93 | 68 | .578 | 4.5 |
 Red Sox - w | 87 | 75 | .537 | 11.0 |
79 | 82 | .491 | 18.5 | |
79 | 83 | .488 | 19.0 | |
| AL Central | W | L | PCT | GB |
 Guardians - y | 85 | 77 | .525 | |
 White Sox - w | 84 | 78 | .519 | 1.0 |
77 | 85 | .475 | 8.0 | |
76 | 86 | .469 | 9.0 | |
69 | 93 | .426 | 16.0 | |
| AL West | W | L | PCT | GB |
 Astros - y | 81 | 81 | .500 | |
80 | 82 | .494 | 1.0 | |
76 | 86 | .469 | 5.0 | |
64 | 98 | .395 | 17.0 | |
62 | 100 | .383 | 19.0 |
 Twins
 Tigers
 Royals
 Rangers
 Athletics
 Angels