
Mitchell Robinson has the best career offensive rebounding percentage for the Knicks, at 17.2 percent.
| NAME | ORB% | MIN | GP | MPG | PPG | RPG | APG | SPG | BPG | FGM | FGA | FG% | 3PM | 3PA | 3P% | FTM | FTA | FT% | TS% | OREB | DREB | TPG | PTS | REB | AST | STL | BLK | TOV | PF | +/- | ||
|---|---|---|---|---|---|---|---|---|---|---|---|---|---|---|---|---|---|---|---|---|---|---|---|---|---|---|---|---|---|---|---|---|
| 1 |  | M. Robinson | 17.2 | 9,294 | 397 | 23.4 | 7.5 | 8.0 | 0.7 | 0.9 | 1.7 | 3.2 | 4.6 | 70.2 | 0.0 | 0.0 | 1.1 | 2.1 | 50.8 | 68.1 | 3.7 | 4.2 | 0.7 | 2,976 | 3,164 | 264 | 362 | 690 | 275 | 1,060 | -30 | |
| 2 |  | C. Oakley | 12.6 | 23,959 | 727 | 33.0 | 10.4 | 10.0 | 2.3 | 1.2 | 0.2 | 4.0 | 8.1 | 49.3 | 0.0 | 0.2 | 22.0 | 2.3 | 3.0 | 78.2 | 55.0 | 3.5 | 6.5 | 2.2 | 7,528 | 7,291 | 1,699 | 844 | 159 | 1,572 | 2,577 | +232 |
| 3 |  | T. Chandler | 12.4 | 5,887 | 183 | 32.2 | 10.2 | 10.1 | 1.0 | 0.7 | 1.2 | 3.8 | 5.9 | 63.8 | 0.0 | 0.0 | 0.0 | 2.7 | 4.0 | 67.9 | 66.8 | 3.5 | 6.6 | 1.4 | 1,868 | 1,844 | 177 | 134 | 227 | 260 | 519 | +392 |
| 4 |  | M. Camby | 12.1 | 5,877 | 221 | 26.6 | 9.3 | 8.3 | 0.7 | 0.8 | 1.8 | 3.7 | 7.5 | 49.1 | 0.0 | 0.0 | 18.2 | 1.9 | 3.0 | 63.7 | 52.7 | 2.6 | 5.7 | 1.0 | 2,053 | 1,839 | 160 | 179 | 390 | 231 | 675 | +8 |
| 5 | | M. Webster | 11.6 | 8,678 | 402 | 21.6 | 6.0 | 6.2 | 1.1 | 0.4 | 1.3 | 2.3 | 4.9 | 48.1 | 0.0 | 0.0 | 20.0 | 1.4 | 2.3 | 60.1 | 51.6 | 2.2 | 4.0 | 1.4 | 2,427 | 2,499 | 454 | 145 | 541 | 570 | 1,017 | |
| 6 | | D. Lee | 10.5 | 11,059 | 368 | 30.1 | 13.0 | 9.6 | 1.9 | 0.8 | 0.4 | 5.2 | 9.4 | 55.7 | 0.0 | 0.0 | 0.0 | 2.5 | 3.2 | 77.4 | 60.0 | 2.8 | 6.8 | 1.6 | 4,775 | 3,529 | 711 | 298 | 134 | 579 | 1,006 | -728 |
| 7 | | J. Jeffries | 9.6 | 6,596 | 299 | 22.1 | 4.3 | 3.9 | 1.2 | 0.8 | 0.6 | 1.7 | 3.9 | 42.9 | 0.1 | 0.5 | 22.5 | 0.8 | 1.5 | 57.9 | 47.2 | 1.9 | 2.0 | 1.0 | 1,289 | 1,168 | 347 | 233 | 183 | 298 | 735 | -260 |
| 8 | | P. Cummings | 9.5 | 5,078 | 205 | 24.8 | 11.0 | 6.6 | 1.1 | 0.6 | 0.2 | 4.5 | 9.2 | 48.4 | 0.0 | 0.0 | 0.0 | 2.0 | 2.7 | 74.1 | 52.5 | 2.1 | 4.4 | 2.0 | 2,246 | 1,345 | 231 | 123 | 46 | 403 | 671 | |
| 9 | | A. Mason | 9.5 | 12,536 | 395 | 31.7 | 9.9 | 7.7 | 2.6 | 0.7 | 0.3 | 3.7 | 7.0 | 52.8 | 0.0 | 0.0 | 0.0 | 2.5 | 3.6 | 68.1 | 57.4 | 2.5 | 5.2 | 1.7 | 3,893 | 3,054 | 1,030 | 258 | 103 | 679 | 1,158 | |
| 10 | | K. Walker | 9.2 | 7,387 | 351 | 21.0 | 7.7 | 4.2 | 0.7 | 0.6 | 0.7 | 3.1 | 6.4 | 48.7 | 0.0 | 0.1 | 22.6 | 1.5 | 2.0 | 75.8 | 53.3 | 1.7 | 2.4 | 0.8 | 2,720 | 1,457 | 259 | 204 | 235 | 292 | 986 | |
| 11 | | S. Williams | 8.6 | 5,438 | 252 | 21.6 | 11.1 | 4.2 | 1.9 | 1.1 | 0.2 | 4.4 | 8.9 | 49.6 | 0.0 | 0.2 | 15.0 | 2.2 | 3.1 | 69.6 | 53.7 | 1.7 | 2.5 | 1.7 | 2,788 | 1,054 | 491 | 285 | 45 | 437 | 591 | |
| 12 |  | A. Stoudemire | 8.5 | 7,426 | 255 | 29.1 | 17.3 | 6.7 | 1.3 | 0.6 | 1.1 | 6.6 | 12.8 | 51.8 | 0.1 | 0.2 | 31.9 | 4.0 | 5.1 | 77.5 | 57.4 | 2.2 | 4.5 | 2.2 | 4,411 | 1,713 | 338 | 162 | 287 | 566 | 771 | -145 |
| 13 | | E. Curry | 8.5 | 6,318 | 222 | 28.5 | 15.2 | 5.8 | 0.5 | 0.3 | 0.6 | 5.5 | 9.8 | 56.3 | 0.0 | 0.0 | 100.0 | 4.1 | 6.6 | 62.1 | 59.6 | 2.0 | 3.8 | 2.8 | 3,367 | 1,295 | 119 | 76 | 126 | 615 | 679 | -1032 |
| 14 | | J. Gianelli | 8.2 | 7,182 | 251 | 28.6 | 9.2 | 7.0 | 1.5 | 0.4 | 1.0 | 3.8 | 8.1 | 47.4 | 1.5 | 2.1 | 71.8 | 50.9 | 2.3 | 4.7 | 2,300 | 1,762 | 381 | 100 | 250 | 670 | ||||||
| 15 | | C. Smith | 8.2 | 6,317 | 241 | 26.2 | 11.3 | 4.5 | 1.4 | 0.6 | 1.2 | 4.1 | 9.1 | 45.4 | 0.1 | 0.3 | 26.6 | 2.9 | 3.8 | 76.9 | 52.2 | 1.8 | 2.7 | 1.8 | 2,719 | 1,081 | 341 | 141 | 287 | 427 | 808 | |
| 16 | | T. Knight | 8.1 | 7,331 | 283 | 25.9 | 12.9 | 5.1 | 1.2 | 0.9 | 0.7 | 5.7 | 10.9 | 51.9 | 0.0 | 0.0 | 0.0 | 1.5 | 2.1 | 74.0 | 54.4 | 2.0 | 3.1 | 1.6 | 3,640 | 1,444 | 335 | 242 | 185 | 444 | 896 | |
| 17 | | S. Haywood | 8.0 | 6,701 | 210 | 31.9 | 17.1 | 8.6 | 1.5 | 0.5 | 1.0 | 7.0 | 15.1 | 46.3 | 3.1 | 4.1 | 75.7 | 50.5 | 2.5 | 6.1 | 2.2 | 3,587 | 1,806 | 324 | 114 | 210 | 227 | 623 | ||||
| 18 | | K. Thomas | 8.0 | 16,421 | 569 | 28.9 | 10.6 | 7.5 | 1.4 | 0.8 | 0.8 | 4.5 | 9.3 | 48.6 | 0.0 | 0.0 | 33.3 | 1.5 | 2.0 | 77.7 | 52.1 | 2.0 | 5.6 | 1.4 | 6,027 | 4,272 | 779 | 445 | 479 | 807 | 2,069 | -180 |
| 19 | 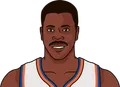 | P. Ewing | 7.9 | 37,586 | 1,039 | 36.2 | 22.8 | 10.4 | 2.0 | 1.0 | 2.7 | 8.9 | 17.5 | 50.8 | 0.0 | 0.1 | 15.6 | 4.9 | 6.6 | 74.2 | 55.7 | 2.5 | 7.9 | 3.2 | 23,665 | 10,759 | 2,088 | 1,061 | 2,758 | 3,321 | 3,676 | +591 |
| 20 | | B. Cartwright | 7.5 | 16,791 | 537 | 31.3 | 16.8 | 7.1 | 1.5 | 0.6 | 1.0 | 6.0 | 10.8 | 55.2 | 0.0 | 0.0 | 0.0 | 4.8 | 6.2 | 78.4 | 62.0 | 2.1 | 5.1 | 2.3 | 9,006 | 3,838 | 792 | 313 | 543 | 1,261 | 1,751 | |
| 21 |  | B. McAdoo | 7.2 | 6,807 | 171 | 39.8 | 26.7 | 12.0 | 3.3 | 1.3 | 1.4 | 10.5 | 19.9 | 52.9 | 5.6 | 7.8 | 71.6 | 57.1 | 2.7 | 9.3 | 4.2 | 4,560 | 2,051 | 566 | 228 | 238 | 499 | 619 | ||||
| 22 | | L. Orr | 7.1 | 9,615 | 407 | 23.6 | 9.3 | 3.5 | 1.4 | 0.8 | 0.3 | 3.5 | 7.6 | 45.6 | 0.0 | 0.1 | 9.1 | 2.3 | 2.9 | 78.1 | 51.9 | 1.5 | 2.0 | 1.3 | 3,768 | 1,425 | 587 | 344 | 112 | 528 | 798 | |
| 23 |  | L. Johnson | 6.7 | 11,050 | 330 | 33.5 | 12.3 | 5.5 | 2.3 | 0.7 | 0.3 | 4.7 | 10.1 | 46.4 | 0.6 | 1.8 | 32.0 | 2.3 | 3.1 | 75.6 | 53.6 | 1.8 | 3.7 | 1.6 | 4,045 | 1,821 | 745 | 219 | 95 | 543 | 1,003 | +427 |
| 24 | | P. Jackson | 6.2 | 7,483 | 379 | 19.7 | 7.0 | 4.6 | 1.3 | 0.6 | 0.5 | 2.7 | 5.8 | 46.6 | 1.6 | 2.0 | 75.8 | 51.9 | 1.2 | 3.5 | 0.7 | 2,642 | 1,760 | 506 | 231 | 173 | 47 | 1,172 | ||||
| 25 | | M. Ray Richardson | 6.1 | 10,497 | 315 | 33.3 | 14.2 | 6.0 | 7.1 | 2.6 | 0.4 | 5.9 | 12.7 | 46.0 | 0.3 | 1.3 | 22.0 | 2.3 | 3.5 | 65.8 | 49.9 | 1.8 | 4.1 | 3.5 | 4,485 | 1,882 | 2,244 | 810 | 129 | 1,093 | 1,023 | |
StatMuse has season-level data for offensive rebounding percentage going back to the 1973-74 season.
More NBA News
Maxey scores 32 as 76ers rally from 29 down to beat Cavaliers

Thunder overcome SGA's shooting woes to beat Nuggets 96-84 in home opener

James, Embiid, Maxey spark 76ers' rally from 29 points down in home opener to stun Cavs 114-106

New contact in hand, Brandon Miller looks to end Hornets' 10-year playoff drought

Trump blasts 76ers star LeBron James as 'disgrace' for not standing still during national anthem
After review, the refs admit it: LaMelo Ball really did travel on side-step 3-pointer in Miami

More Knicks Stats
Team Leaders 


PPG
21.0
Brunson
RPG
14.0
Drummond
APG
4.0
Shamet
Team Rankings
ORTG
96.4
26th
DRTG
102.2
8th
NETRTG
-5.8
16th
3P%
33.3
14th
 Hornets
 Pacers
 Knicks
 Nets
 Magic
 BOS
 DET
 CHI
 PHI


NBA 2026-27 Leaders












NBA 2026-27 Rankings


NBA Fantasy 2026-27




NBA 2026-27 Betting

NBA 2026-27 Standings
| Eastern | W | L | PCT | GB | |
|---|---|---|---|---|---|
| 1 | 2 | 0 | 1.000 | ||
| 2 | 1 | 0 | 1.000 | 0.5 | |
| 3 | 1 | 0 | 1.000 | 0.5 | |
| 4 | 1 | 0 | 1.000 | 0.5 | |
| 5 | 1 | 0 | 1.000 | 0.5 | |
| 6 | 1 | 0 | 1.000 | 0.5 | |
| 7 | 1 | 0 | 1.000 | 0.5 | |
| 8 | 0 | 1 | .000 | 1.5 | |
| 9 | 0 | 1 | .000 | 1.5 | |
| 10 | 0 | 1 | .000 | 1.5 | |
| 11 | 0 | 1 | .000 | 1.5 | |
| 12 | 0 | 1 | .000 | 1.5 | |
| 13 | 0 | 1 | .000 | 1.5 | |
| 14 | 0 | 1 | .000 | 1.5 | |
| 15 | 0 | 1 | .000 | 1.5 |
 Hawks
 Raptors
 Wizards
 Cavaliers
 Bucks
 Heat
| Western | W | L | PCT | GB | |
|---|---|---|---|---|---|
| 1 | 2 | 0 | 1.000 | ||
| 2 | 1 | 0 | 1.000 | 0.5 | |
| 3 | 1 | 0 | 1.000 | 0.5 | |
| 4 | 1 | 0 | 1.000 | 0.5 | |
| 5 | 1 | 0 | 1.000 | 0.5 | |
| 6 | 1 | 0 | 1.000 | 0.5 | |
| 7 | 1 | 0 | 1.000 | 0.5 | |
| 8 | 0 | 1 | .000 | 1.5 | |
| 9 | 0 | 1 | .000 | 1.5 | |
| 10 | 0 | 1 | .000 | 1.5 | |
| 11 | 0 | 1 | .000 | 1.5 | |
| 12 | 0 | 1 | .000 | 1.5 | |
| 13 | 0 | 1 | .000 | 1.5 | |
| 14 | 0 | 1 | .000 | 1.5 | |
| 15 | 0 | 1 | .000 | 1.5 |
 Thunder
 Clippers
 Rockets
 Trail Blazers
 Lakers
 Grizzlies
 Timberwolves
 Nuggets
 Spurs
 Mavericks
 Jazz
 Warriors
 Kings
 Suns
 Pelicans