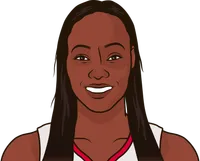
Since 2000, Cheryl Ford has the most personal fouls per game in a season, with 4.3 per game in 2005.
Showing
| NAME | PF | SEASON | TM | GP | MPG | PPG | RPG | APG | SPG | BPG | FGM | FGA | FG% | 3PM | 3PA | 3P% | FTM | FTA | FT% | TS% | OREB | DREB | TPG | MIN | PTS | REB | AST | STL | BLK | TOV | +/- | ||
|---|---|---|---|---|---|---|---|---|---|---|---|---|---|---|---|---|---|---|---|---|---|---|---|---|---|---|---|---|---|---|---|---|---|
| 1 |  | C. Ford | 4.3 | 2005 | 33 | 28.2 | 9.5 | 9.8 | 0.8 | 1.0 | 1.4 | 3.6 | 8.5 | 43.0 | 0.0 | 0.0 | 2.2 | 4.5 | 48.7 | 45.4 | 3.4 | 6.3 | 2.1 | 932 | 313 | 322 | 26 | 33 | 46 | 69 | +70 | ||
| 2 |  | N. Williams | 4.3 | 2000 | 29 | 35.9 | 18.7 | 11.6 | 1.8 | 1.2 | 0.6 | 6.2 | 12.6 | 49.0 | 0.1 | 0.2 | 60.0 | 6.3 | 7.9 | 79.8 | 58.3 | 4.6 | 7.0 | 2.7 | 1,040 | 543 | 336 | 51 | 35 | 18 | 79 | -12 | |
| 3 |  | L. Leslie | 4.3 | 2001 | 31 | 33.4 | 19.5 | 9.6 | 2.4 | 1.1 | 2.3 | 7.1 | 15.1 | 47.3 | 0.7 | 1.9 | 36.7 | 4.6 | 6.2 | 73.6 | 54.9 | 2.8 | 6.8 | 3.2 | 1,035 | 606 | 298 | 73 | 34 | 71 | 98 | +309 | |
| 4 | | L. Leslie | 4.2 | 2000 | 32 | 32.1 | 17.8 | 9.6 | 1.9 | 1.0 | 2.3 | 6.2 | 13.4 | 45.8 | 0.2 | 1.0 | 21.9 | 5.3 | 6.4 | 82.4 | 54.8 | 2.3 | 7.2 | 3.2 | 1,027 | 570 | 306 | 60 | 31 | 74 | 103 | +252 | |
| 5 | | N. Sanford | 4.1 | 2007 | 34 | 29.2 | 11.0 | 7.1 | 0.7 | 0.8 | 0.8 | 3.6 | 6.8 | 53.0 | 0.0 | 0.0 | 3.8 | 5.7 | 66.5 | 59.1 | 2.9 | 4.2 | 2.6 | 994 | 375 | 242 | 23 | 27 | 28 | 88 | -70 | ||
| 6 | | N. Williams | 4.1 | 2001 | 31 | 34.4 | 14.2 | 9.9 | 1.8 | 1.3 | 0.3 | 5.5 | 11.3 | 49.0 | 0.0 | 0.1 | 0.0 | 3.1 | 4.3 | 72.9 | 53.9 | 3.6 | 6.4 | 2.3 | 1,066 | 439 | 308 | 55 | 41 | 10 | 70 | +22 | |
| 7 |  | Y. Griffith | 4.1 | 2002 | 17 | 34.1 | 16.9 | 8.7 | 1.1 | 0.9 | 0.8 | 5.5 | 10.5 | 52.0 | 0.0 | 0.0 | 6.0 | 7.5 | 80.3 | 61.3 | 3.9 | 4.8 | 2.6 | 579 | 288 | 148 | 19 | 16 | 13 | 45 | +43 | ||
| 8 | | O. Scott | 4.1 | 2002 | 31 | 31.4 | 9.4 | 6.8 | 1.7 | 1.2 | 0.4 | 3.6 | 7.5 | 48.7 | 0.0 | 0.1 | 0.0 | 2.1 | 2.6 | 80.5 | 54.5 | 2.6 | 4.2 | 2.2 | 974 | 292 | 211 | 52 | 38 | 13 | 69 | -55 | |
| 9 | | J. Burse | 4.1 | 2005 | 34 | 25.4 | 10.0 | 5.9 | 0.7 | 0.6 | 1.2 | 3.7 | 7.1 | 52.3 | 0.0 | 0.0 | 2.5 | 3.6 | 69.9 | 57.2 | 2.4 | 3.5 | 2.3 | 862 | 340 | 199 | 23 | 19 | 40 | 78 | +63 | ||
| 10 | | N. Sanford | 4.1 | 2008 | 34 | 23.4 | 6.7 | 5.7 | 1.2 | 0.6 | 0.3 | 2.6 | 5.9 | 45.2 | 0.0 | 0.0 | 1.4 | 3.6 | 39.8 | 45.2 | 2.3 | 3.4 | 2.4 | 795 | 229 | 193 | 40 | 21 | 11 | 83 | -81 | ||
| 11 | | T. Sutton-Brown | 4.1 | 2005 | 34 | 26.1 | 9.4 | 5.3 | 0.4 | 0.9 | 1.1 | 3.3 | 6.4 | 50.9 | 0.0 | 0.0 | 2.8 | 4.1 | 68.1 | 56.8 | 1.9 | 3.4 | 2.0 | 888 | 318 | 179 | 14 | 30 | 37 | 69 | -152 | ||
| 12 | | N. Williams | 4.1 | 2003 | 34 | 31.0 | 13.4 | 7.5 | 1.4 | 1.3 | 0.6 | 5.2 | 10.7 | 48.5 | 0.0 | 0.0 | 0.0 | 3.1 | 4.4 | 70.9 | 53.4 | 3.2 | 4.3 | 2.1 | 1,054 | 457 | 255 | 46 | 43 | 21 | 70 | -3 | |
| 13 | | L. Leslie | 4.0 | 2003 | 23 | 34.4 | 18.4 | 10.0 | 2.0 | 1.3 | 2.7 | 7.2 | 16.2 | 44.2 | 0.5 | 1.6 | 32.4 | 3.6 | 5.8 | 61.7 | 49.1 | 3.3 | 6.7 | 2.8 | 791 | 424 | 231 | 46 | 31 | 63 | 65 | +176 | |
| 14 |  | R. Riley | 4.0 | 2005 | 33 | 26.1 | 7.6 | 4.7 | 1.2 | 0.7 | 1.4 | 3.0 | 8.1 | 37.5 | 0.1 | 0.4 | 25.0 | 1.5 | 1.8 | 80.0 | 42.8 | 1.3 | 3.4 | 2.1 | 860 | 251 | 156 | 39 | 23 | 46 | 68 | +25 | |
| 15 | | L. Leslie | 4.0 | 2002 | 31 | 34.2 | 16.9 | 10.4 | 2.7 | 1.5 | 2.9 | 6.1 | 13.1 | 46.6 | 0.4 | 1.2 | 32.4 | 4.3 | 5.9 | 72.7 | 53.7 | 2.5 | 7.9 | 3.5 | 1,060 | 523 | 322 | 83 | 46 | 90 | 108 | +263 | |
| 16 |  | T. Smith | 3.9 | 2002 | 32 | 33.2 | 14.7 | 5.9 | 1.3 | 0.8 | 1.4 | 5.8 | 13.6 | 42.3 | 0.5 | 1.3 | 35.7 | 2.7 | 3.2 | 85.1 | 48.9 | 1.8 | 4.1 | 1.8 | 1,063 | 469 | 188 | 40 | 27 | 46 | 59 | -123 | |
| 17 | | N. Williams | 3.9 | 2002 | 31 | 32.5 | 11.3 | 8.2 | 1.2 | 1.2 | 0.5 | 4.0 | 9.2 | 43.5 | 0.2 | 0.4 | 41.7 | 3.2 | 4.3 | 74.2 | 51.2 | 3.4 | 4.8 | 2.3 | 1,007 | 351 | 255 | 38 | 38 | 16 | 72 | +13 | |
| 18 |  | T. Smith | 3.9 | 2008 | 25 | 28.9 | 11.1 | 7.0 | 1.1 | 1.1 | 1.2 | 4.4 | 10.6 | 41.7 | 0.6 | 1.8 | 34.8 | 1.6 | 1.8 | 86.7 | 48.5 | 2.0 | 5.0 | 1.6 | 722 | 277 | 176 | 28 | 28 | 29 | 41 | -9 | |
| 19 | | T. Sutton-Brown | 3.9 | 2002 | 32 | 27.7 | 11.9 | 6.0 | 0.5 | 0.9 | 1.1 | 4.0 | 7.6 | 52.9 | 0.0 | 0.0 | 3.9 | 5.4 | 71.3 | 59.6 | 2.4 | 3.6 | 1.5 | 886 | 380 | 191 | 15 | 29 | 36 | 49 | +112 | ||
| 20 | | T. Sutton-Brown | 3.9 | 2003 | 34 | 25.4 | 8.4 | 5.9 | 0.4 | 0.6 | 1.5 | 2.9 | 6.9 | 42.1 | 0.0 | 0.0 | 2.6 | 3.9 | 68.7 | 49.2 | 2.1 | 3.8 | 1.7 | 862 | 286 | 201 | 15 | 19 | 50 | 59 | -42 | ||
| 21 |  | D. Milton-Jones | 3.9 | 2000 | 32 | 30.8 | 11.8 | 6.1 | 2.1 | 1.4 | 0.9 | 4.7 | 9.2 | 51.2 | 0.1 | 0.3 | 25.0 | 2.4 | 3.2 | 74.5 | 55.9 | 1.7 | 4.3 | 2.1 | 984 | 378 | 194 | 68 | 44 | 29 | 67 | +316 | |
| 22 | | L. Leslie | 3.8 | 2004 | 34 | 33.8 | 17.6 | 9.9 | 2.6 | 1.5 | 2.9 | 6.6 | 13.3 | 49.4 | 0.2 | 0.6 | 27.3 | 4.3 | 6.0 | 71.2 | 55.2 | 1.8 | 8.1 | 3.2 | 1,148 | 598 | 336 | 88 | 50 | 98 | 110 | +123 | |
| 23 | | D. Milton-Jones | 3.8 | 2002 | 32 | 30.1 | 11.3 | 6.6 | 1.4 | 1.6 | 1.1 | 4.1 | 8.5 | 48.7 | 0.7 | 1.6 | 42.0 | 2.4 | 3.3 | 74.0 | 57.1 | 2.0 | 4.6 | 2.9 | 964 | 362 | 211 | 45 | 50 | 35 | 94 | +159 | |
| 24 | | C. Ford | 3.8 | 2004 | 31 | 29.5 | 10.6 | 9.6 | 1.1 | 1.3 | 0.8 | 3.8 | 9.3 | 41.1 | 0.0 | 0.0 | 3.0 | 5.1 | 58.9 | 46.1 | 3.4 | 6.2 | 1.7 | 916 | 329 | 297 | 34 | 41 | 25 | 54 | -63 | ||
| 25 |  | R. Riley | 3.8 | 2007 | 30 | 25.8 | 5.9 | 4.9 | 1.2 | 0.9 | 2.0 | 2.4 | 6.5 | 37.1 | 0.2 | 0.9 | 18.5 | 0.9 | 1.0 | 93.1 | 42.6 | 1.1 | 3.9 | 2.3 | 773 | 176 | 148 | 37 | 27 | 59 | 69 | +107 | |
 DET
 UTA
 LAS
 WAS
 SAC
 SEA
 CHA
 PHX
 CHA
 SAN
More WNBA News
Dream star Angel Reese, coach Karl Smesko frustrated with fouling by Golden State in WNBA Finals

Kiah Stokes' big night on both ends leads Valkyries past Dream 64-55 and within a win of WNBA title

Atlanta gets home matinee for Game 6 of WNBA Finals against Valkyries as NBA keeps primetime slot

Lineup switch by coach Natalie Nakase works out as Valkyries even WNBA Finals series with Dream at 2

Angel Reese blames herself after a dramatic falloff in Dream's Game 4 loss in the WNBA Finals
Golden State Valkyries beat the Atlanta Dream 67-62 to even the WNBA Finals at 2-2
More Wings Stats
Team Leaders 


PPG
28.3
Ogunbowale
RPG
7.7
Shepard
APG
4.0
Bueckers
Team Rankings
ORTG
111.9
5th
DRTG
106.7
6th
NETRTG
5.2
6th
3P%
34.6
5th


WNBA 2026 Leaders


WNBA 2026 Rankings


WNBA Fantasy 2026


WNBA 2026 Betting


WNBA 2026 Standings
| Team | W | L | PCT | GB | |
|---|---|---|---|---|---|
| 1 |  Lynx - x | 33 | 11 | .750 | |
| 2 |  Valkyries - x | 32 | 12 | .727 | 1.0 |
| 3 |  Aces - x | 31 | 13 | .705 | 2.0 |
| 4 |  Dream - x | 30 | 14 | .682 | 3.0 |
| 5 |  Mystics - x | 28 | 16 | .636 | 5.0 |
| 6 |  Fever - x | 28 | 16 | .636 | 5.0 |
| 7 |  Wings - x | 27 | 17 | .614 | 6.0 |
| 8 |  Liberty - x | 26 | 18 | .591 | 7.0 |
| 9 |  Fire - e | 17 | 27 | .386 | 16.0 |
| 10 |  Sparks - e | 16 | 28 | .364 | 17.0 |
| 11 |  Sky - e | 16 | 28 | .364 | 17.0 |
| 12 |  Mercury - e | 16 | 28 | .364 | 17.0 |
| 13 |  Tempo - e | 11 | 33 | .250 | 22.0 |
| 14 |  Sun - e | 11 | 33 | .250 | 22.0 |
| 15 |  Storm - e | 8 | 36 | .182 | 25.0 |