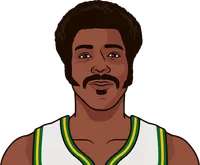
Since 1976-77, Paul Silas has the worst field-goal percentage by a forward in the playoffs when playing 50+ games, at 36.2 percent.
| NAME | FG% | GP | MPG | PPG | RPG | APG | SPG | BPG | FGM | FGA | 3PM | 3PA | 3P% | FTM | FTA | FT% | TS% | OREB | DREB | TPG | MIN | PTS | REB | AST | STL | BLK | TOV | PF | +/- | ||
|---|---|---|---|---|---|---|---|---|---|---|---|---|---|---|---|---|---|---|---|---|---|---|---|---|---|---|---|---|---|---|---|
| 1 | P. Silas | 36.2 | 60 | 23.7 | 4.3 | 6.7 | 1.4 | 0.5 | 0.3 | 1.4 | 3.7 | 0.0 | 0.0 | 1.6 | 2.4 | 67.1 | 45.0 | 2.7 | 4.0 | 1.4 | 1,421 | 258 | 400 | 86 | 32 | 17 | 73 | 155 | |||
| 2 | A. Harrington | 37.4 | 55 | 20.4 | 7.3 | 4.2 | 0.7 | 0.8 | 0.4 | 2.7 | 7.2 | 0.6 | 1.8 | 31.7 | 1.3 | 2.2 | 60.5 | 44.6 | 1.3 | 3.0 | 1.1 | 1,124 | 400 | 232 | 37 | 43 | 20 | 60 | 159 | +10 | |
| 3 | D. Ferry | 37.4 | 67 | 14.3 | 3.7 | 2.1 | 0.9 | 0.2 | 0.1 | 1.4 | 3.7 | 0.7 | 1.9 | 36.8 | 0.3 | 0.4 | 75.0 | 48.3 | 0.4 | 1.7 | 0.4 | 961 | 248 | 144 | 63 | 16 | 8 | 27 | 116 | -7 | |
| 4 | M. Williams | 37.8 | 59 | 23.9 | 6.7 | 4.3 | 0.8 | 0.6 | 0.4 | 2.3 | 6.2 | 0.5 | 1.3 | 38.7 | 1.6 | 1.9 | 83.6 | 48.0 | 1.2 | 3.1 | 0.7 | 1,409 | 397 | 256 | 45 | 36 | 25 | 44 | 101 | -284 | |
| 5 | A. Croshere | 37.9 | 68 | 18.2 | 6.7 | 3.6 | 0.7 | 0.4 | 0.4 | 1.9 | 5.0 | 0.6 | 1.7 | 36.0 | 2.2 | 2.6 | 84.4 | 53.6 | 1.1 | 2.5 | 0.9 | 1,236 | 453 | 246 | 49 | 27 | 24 | 63 | 121 | +15 | |
| 6 | M.L. Carr | 38.2 | 67 | 15.0 | 5.3 | 1.9 | 1.0 | 0.6 | 0.1 | 2.1 | 5.6 | 0.1 | 0.3 | 22.7 | 1.0 | 1.4 | 71.4 | 43.0 | 0.9 | 1.0 | 0.6 | 1,005 | 354 | 129 | 64 | 38 | 10 | 40 | 111 | ||
| 7 | G. Niang | 38.7 | 56 | 13.8 | 4.4 | 1.5 | 0.6 | 0.1 | 0.1 | 1.6 | 4.1 | 1.0 | 2.9 | 34.1 | 0.3 | 0.3 | 93.8 | 52.5 | 0.2 | 1.2 | 0.6 | 774 | 249 | 82 | 34 | 8 | 7 | 31 | 97 | -2 | |
| 8 | K. Van Horn | 38.8 | 57 | 25.7 | 9.5 | 5.1 | 1.1 | 0.6 | 0.3 | 3.4 | 8.8 | 1.1 | 2.8 | 39.1 | 1.6 | 2.0 | 79.5 | 49.2 | 1.3 | 3.8 | 1.4 | 1,464 | 542 | 293 | 61 | 37 | 18 | 80 | 149 | -59 | |
| 9 | C. Butler | 38.9 | 53 | 29.8 | 10.0 | 4.7 | 1.5 | 1.0 | 0.3 | 3.6 | 9.2 | 0.8 | 2.6 | 29.0 | 2.1 | 2.5 | 82.2 | 48.5 | 0.8 | 3.8 | 1.4 | 1,580 | 529 | 248 | 79 | 52 | 14 | 72 | 130 | -190 | |
| 10 | M. Sandiford-Artest | 38.9 | 85 | 36.9 | 13.9 | 4.8 | 2.8 | 1.5 | 0.7 | 5.1 | 13.0 | 1.5 | 4.9 | 30.8 | 2.2 | 3.1 | 71.4 | 48.2 | 1.4 | 3.4 | 1.7 | 3,135 | 1,180 | 408 | 234 | 131 | 56 | 141 | 244 | +98 | |
| 11 | J. Mashburn | 38.9 | 52 | 35.6 | 15.0 | 4.7 | 3.2 | 0.9 | 0.2 | 5.3 | 13.7 | 1.1 | 3.0 | 36.9 | 3.3 | 4.2 | 78.0 | 48.4 | 1.1 | 3.6 | 2.2 | 1,849 | 782 | 242 | 165 | 49 | 9 | 113 | 148 | +19 | |
| 12 | J. Crowder | 39.2 | 115 | 28.5 | 10.1 | 5.2 | 1.8 | 0.9 | 0.5 | 3.4 | 8.6 | 1.8 | 5.4 | 33.3 | 1.5 | 2.0 | 77.0 | 53.2 | 0.7 | 4.5 | 0.8 | 3,282 | 1,158 | 593 | 210 | 102 | 54 | 96 | 306 | -140 | |
| 13 | R. Rogers | 39.2 | 82 | 20.9 | 7.9 | 3.9 | 1.4 | 0.7 | 0.5 | 2.7 | 6.9 | 0.8 | 2.5 | 31.0 | 1.6 | 2.2 | 73.4 | 49.5 | 1.1 | 2.8 | 1.3 | 1,717 | 644 | 318 | 117 | 54 | 41 | 105 | 226 | -6 | |
| 14 | G. Green | 39.3 | 62 | 12.5 | 5.5 | 1.8 | 0.2 | 0.2 | 0.2 | 1.9 | 4.9 | 1.2 | 3.1 | 37.8 | 0.4 | 0.5 | 89.3 | 53.3 | 0.2 | 1.6 | 0.5 | 776 | 338 | 111 | 15 | 14 | 13 | 28 | 84 | -45 | |
| 15 | C. Robinson | 39.4 | 129 | 27.4 | 10.5 | 3.9 | 1.8 | 1.0 | 1.0 | 3.9 | 9.8 | 0.6 | 2.0 | 29.9 | 2.1 | 3.4 | 62.2 | 46.3 | 1.3 | 2.6 | 1.6 | 3,540 | 1,352 | 503 | 235 | 129 | 123 | 209 | 455 | -127 | |
| 16 | B. Bowen | 39.4 | 135 | 31.0 | 6.0 | 2.7 | 1.3 | 0.8 | 0.5 | 2.1 | 5.4 | 1.2 | 2.9 | 42.2 | 0.5 | 0.9 | 55.3 | 51.8 | 0.4 | 2.3 | 0.6 | 4,191 | 808 | 366 | 177 | 108 | 64 | 84 | 363 | -31 | |
| 17 | S. Battier | 39.5 | 95 | 25.4 | 5.8 | 2.6 | 0.8 | 0.6 | 0.4 | 1.9 | 4.8 | 1.3 | 3.5 | 36.8 | 0.7 | 0.9 | 75.3 | 55.3 | 0.7 | 1.9 | 0.6 | 2,417 | 548 | 250 | 80 | 61 | 42 | 60 | 240 | +107 | |
| 18 | D. George | 39.5 | 86 | 17.2 | 5.0 | 2.7 | 0.7 | 0.7 | 0.3 | 1.8 | 4.7 | 0.7 | 2.1 | 32.6 | 0.6 | 0.9 | 67.5 | 49.2 | 0.7 | 2.0 | 0.6 | 1,479 | 427 | 231 | 57 | 56 | 27 | 51 | 168 | +63 | |
| 19 | M. Strus | 39.6 | 62 | 30.0 | 10.2 | 4.4 | 2.3 | 0.6 | 0.3 | 3.6 | 9.1 | 2.3 | 6.7 | 33.9 | 0.7 | 0.9 | 79.6 | 53.7 | 0.9 | 3.5 | 0.8 | 1,857 | 630 | 271 | 141 | 37 | 17 | 48 | 166 | +87 | |
| 20 | D. Gallinari | 39.6 | 51 | 26.9 | 13.2 | 4.5 | 1.4 | 0.6 | 0.2 | 4.3 | 10.9 | 1.5 | 4.3 | 33.8 | 3.1 | 3.4 | 89.7 | 53.1 | 0.7 | 3.8 | 1.2 | 1,374 | 671 | 228 | 70 | 29 | 9 | 63 | 109 | -179 | |
| 21 | S. Mitchell | 39.8 | 59 | 14.5 | 4.5 | 2.2 | 0.6 | 0.2 | 0.2 | 1.7 | 4.2 | 0.1 | 0.5 | 20.7 | 1.1 | 1.4 | 81.3 | 47.5 | 0.7 | 1.5 | 0.7 | 854 | 267 | 130 | 34 | 10 | 9 | 39 | 122 | -60 | |
| 22 | M. Barnes | 39.9 | 95 | 22.6 | 6.7 | 4.1 | 1.4 | 0.9 | 0.3 | 2.5 | 6.1 | 0.9 | 3.0 | 29.7 | 0.9 | 1.2 | 75.2 | 50.2 | 1.2 | 2.9 | 1.1 | 2,147 | 638 | 390 | 132 | 85 | 30 | 105 | 264 | +3 | |
| 23 | M. Bonner | 40.2 | 94 | 11.0 | 2.8 | 1.7 | 0.4 | 0.2 | 0.2 | 1.0 | 2.4 | 0.5 | 1.5 | 35.5 | 0.3 | 0.4 | 81.1 | 53.9 | 0.4 | 1.3 | 0.2 | 1,034 | 259 | 156 | 35 | 16 | 17 | 21 | 135 | +21 | |
| 24 | H. Turkoglu | 40.3 | 109 | 27.4 | 9.7 | 3.8 | 2.6 | 0.7 | 0.3 | 3.5 | 8.6 | 0.9 | 2.7 | 34.1 | 1.9 | 2.5 | 75.1 | 50.1 | 0.6 | 3.2 | 1.7 | 2,985 | 1,059 | 416 | 287 | 81 | 32 | 180 | 284 | -80 | |
| 25 | K. Love | 40.4 | 67 | 25.2 | 11.9 | 7.7 | 1.6 | 0.6 | 0.5 | 3.8 | 9.3 | 2.1 | 5.0 | 41.5 | 2.3 | 2.8 | 83.2 | 56.5 | 1.4 | 6.4 | 1.1 | 1,689 | 799 | 519 | 110 | 40 | 33 | 76 | 129 | +283 | |
More Thunder Stats
Team Rankings
ORTG
120.3
3rd
DRTG
107.5
1st
NETRTG
12.8
1st
3P%
37.4
6th


