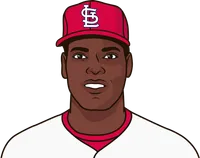
Since 1926, Bob Gibson has the best ERA with 120.0+ innings pitched in a season, with an ERA of 1.12 in 1968.
| NAME | ERA | IP | SEASON | TM | G | W | L | W% | GS | SO | CG | SHO | SV | H | ER | R | HR | BB | HBP | GF | IBB | TBF | WP | K/9 | BB/9 | K/BB | HR/9 | K% | BB% | WHIP | BABIP | RA | ERA- | FIP | FIP- | H/9 | PRAA | ||
|---|---|---|---|---|---|---|---|---|---|---|---|---|---|---|---|---|---|---|---|---|---|---|---|---|---|---|---|---|---|---|---|---|---|---|---|---|---|---|---|
| 1 |  | B. Gibson | 1.12 | 304.2 | 1968 | 34 | 22 | 9 | .710 | 34 | 268 | 28 | 13 | 0 | 198 | 38 | 49 | 11 | 62 | 7 | 0 | 6 | 1,161 | 4 | 7.92 | 1.83 | 4.32 | 0.32 | 23.1 | 5.3 | 0.85 | .230 | 1.45 | 38 | 1.77 | 63 | 5.85 | 34.8 | |
| 2 |  | R. Munger | 1.34 | 121.0 | 1944 | 21 | 11 | 3 | .786 | 12 | 55 | 7 | 2 | 2 | 92 | 18 | 23 | 2 | 41 | 2 | 8 | 479 | 0 | 4.09 | 3.05 | 1.34 | 0.15 | 11.5 | 8.6 | 1.10 | .237 | 1.71 | 37 | 2.91 | 80 | 6.84 | 9.5 | ||
| 3 | | J. Hiller | 1.44 | 125.1 | 1973 | 65 | 10 | 5 | .667 | 0 | 124 | 0 | 0 | 38 | 89 | 20 | 21 | 7 | 39 | 0 | 60 | 7 | 498 | 1 | 8.90 | 2.80 | 3.18 | 0.50 | 24.9 | 7.8 | 1.02 | .250 | 1.51 | 37 | 2.24 | 57 | 6.39 | 22.8 | |
| 4 | | B. Lee | 1.51 | 137.0 | 1964 | 64 | 6 | 5 | .545 | 5 | 111 | 0 | 0 | 19 | 87 | 23 | 31 | 6 | 58 | 1 | 39 | 8 | 545 | 3 | 7.29 | 3.81 | 1.91 | 0.39 | 20.4 | 10.6 | 1.06 | .220 | 2.04 | 44 | 2.85 | 79 | 5.72 | 11.4 | |
| 5 | | D. Gooden | 1.53 | 276.2 | 1985 | 35 | 24 | 4 | .857 | 35 | 268 | 16 | 8 | 0 | 198 | 47 | 51 | 13 | 69 | 2 | 0 | 4 | 1,065 | 6 | 8.72 | 2.24 | 3.88 | 0.42 | 25.2 | 6.5 | 0.97 | .259 | 1.66 | 44 | 2.12 | 59 | 6.44 | 45.6 | |
| 6 | | B. Sutter | 1.54 | 122.2 | 1984 | 71 | 5 | 7 | .417 | 0 | 77 | 0 | 0 | 45 | 109 | 21 | 26 | 9 | 23 | 1 | 63 | 4 | 477 | 2 | 5.65 | 1.69 | 3.35 | 0.66 | 16.1 | 4.8 | 1.08 | .272 | 1.91 | 43 | 3.05 | 87 | 8.00 | 6 | |
| 7 | | S. Rogers | 1.54 | 134.0 | 1973 | 17 | 10 | 5 | .667 | 17 | 64 | 7 | 3 | 0 | 93 | 23 | 28 | 5 | 49 | 1 | 0 | 3 | 527 | 3 | 4.30 | 3.29 | 1.31 | 0.34 | 12.1 | 9.3 | 1.06 | .216 | 1.88 | 41 | 3.21 | 84 | 6.25 | 9.1 | |
| 8 |  | G. Maddux | 1.56 | 202.0 | 1994 | 25 | 16 | 6 | .727 | 25 | 156 | 10 | 3 | 0 | 150 | 35 | 44 | 4 | 31 | 6 | 0 | 3 | 774 | 3 | 6.95 | 1.38 | 5.03 | 0.18 | 20.2 | 4.0 | 0.90 | .253 | 1.96 | 37 | 2.39 | 55 | 6.68 | 43.7 | |
| 9 | | K. Medlen | 1.57 | 138.0 | 2012 | 50 | 10 | 1 | .909 | 12 | 120 | 2 | 1 | 1 | 103 | 24 | 26 | 6 | 23 | 0 | 7 | 0 | 520 | 3 | 7.83 | 1.50 | 5.22 | 0.39 | 23.1 | 4.4 | 0.91 | .261 | 1.70 | 40 | 2.41 | 63 | 6.72 | 22 | |
| 10 | | J. Kern | 1.57 | 143.0 | 1979 | 71 | 13 | 5 | .722 | 0 | 136 | 0 | 0 | 29 | 99 | 25 | 35 | 5 | 62 | 2 | 57 | 6 | 578 | 5 | 8.56 | 3.90 | 2.19 | 0.31 | 23.5 | 10.7 | 1.13 | .252 | 2.20 | 38 | 2.61 | 64 | 6.23 | 23.4 | |
| 11 | | L. Tiant | 1.60 | 258.1 | 1968 | 34 | 21 | 9 | .700 | 32 | 264 | 19 | 9 | 0 | 152 | 46 | 53 | 16 | 73 | 4 | 0 | 4 | 987 | 3 | 9.20 | 2.54 | 3.62 | 0.56 | 26.7 | 7.4 | 0.87 | .216 | 1.85 | 53 | 2.04 | 64 | 5.30 | 33 | |
| 12 | | R. Gossage | 1.62 | 133.0 | 1977 | 72 | 11 | 9 | .550 | 0 | 151 | 0 | 0 | 26 | 78 | 24 | 27 | 9 | 49 | 2 | 55 | 6 | 523 | 2 | 10.22 | 3.32 | 3.08 | 0.61 | 28.9 | 9.4 | 0.95 | .221 | 1.83 | 41 | 2.49 | 63 | 5.28 | 21.4 | |
| 13 | | G. Maddux | 1.63 | 209.2 | 1995 | 28 | 19 | 2 | .905 | 28 | 181 | 10 | 3 | 0 | 147 | 38 | 39 | 8 | 23 | 4 | 0 | 3 | 785 | 1 | 7.77 | 0.99 | 7.87 | 0.34 | 23.1 | 2.9 | 0.81 | .244 | 1.67 | 39 | 2.25 | 52 | 6.31 | 46.9 | |
| 14 | | S. Chandler | 1.64 | 253.0 | 1943 | 30 | 20 | 4 | .833 | 30 | 134 | 20 | 5 | 0 | 197 | 46 | 62 | 5 | 54 | 4 | 0 | 989 | 3 | 4.77 | 1.92 | 2.48 | 0.18 | 13.5 | 5.5 | 0.99 | .242 | 2.21 | 50 | 2.30 | 68 | 7.01 | 29.8 | ||
| 15 | | D. Chance | 1.65 | 278.1 | 1964 | 46 | 20 | 9 | .690 | 35 | 207 | 15 | 11 | 4 | 194 | 51 | 56 | 7 | 86 | 2 | 7 | 9 | 1,093 | 9 | 6.69 | 2.78 | 2.41 | 0.23 | 18.9 | 7.9 | 1.01 | .236 | 1.81 | 48 | 2.39 | 67 | 6.27 | 37.9 | |
| 16 |  | Z. Greinke | 1.66 | 222.2 | 2015 | 32 | 19 | 3 | .864 | 32 | 200 | 1 | 0 | 0 | 148 | 41 | 43 | 14 | 40 | 5 | 0 | 1 | 843 | 7 | 8.08 | 1.62 | 5.00 | 0.57 | 23.7 | 4.7 | 0.84 | .229 | 1.74 | 44 | 2.75 | 73 | 5.98 | 26.2 | |
| 17 | | C. Hubbell | 1.66 | 308.2 | 1933 | 45 | 23 | 12 | .657 | 33 | 156 | 22 | 10 | 5 | 256 | 57 | 69 | 6 | 47 | 3 | 11 | 1,206 | 3 | 4.55 | 1.37 | 3.32 | 0.17 | 12.9 | 3.9 | 0.98 | .252 | 2.01 | 52 | 2.53 | 74 | 7.46 | 31.1 | ||
| 18 | | R. Perranoski | 1.67 | 129.0 | 1963 | 69 | 16 | 3 | .842 | 0 | 75 | 0 | 0 | 21 | 112 | 24 | 30 | 7 | 43 | 4 | 47 | 14 | 541 | 4 | 5.23 | 3.00 | 1.74 | 0.49 | 13.9 | 7.9 | 1.20 | .255 | 2.09 | 55 | 3.11 | 104 | 7.81 | -2.3 | |
| 19 |  | C. Kershaw | 1.69 | 149.0 | 2016 | 21 | 12 | 4 | .750 | 21 | 172 | 3 | 3 | 0 | 97 | 28 | 31 | 8 | 11 | 2 | 0 | 1 | 544 | 5 | 10.39 | 0.66 | 15.64 | 0.48 | 31.6 | 2.0 | 0.72 | .254 | 1.87 | 42 | 1.79 | 44 | 5.86 | 37.9 | |
| 20 |  | N. Ryan | 1.69 | 149.0 | 1981 | 21 | 11 | 5 | .688 | 21 | 140 | 5 | 3 | 0 | 99 | 28 | 34 | 2 | 68 | 1 | 0 | 1 | 605 | 16 | 8.46 | 4.11 | 2.06 | 0.12 | 23.1 | 11.2 | 1.12 | .246 | 2.05 | 52 | 2.28 | 70 | 5.98 | 16.5 | |
| 21 |  | J. deGrom | 1.70 | 217.0 | 2018 | 32 | 10 | 9 | .526 | 32 | 269 | 1 | 0 | 0 | 152 | 41 | 48 | 10 | 46 | 5 | 0 | 3 | 835 | 2 | 11.16 | 1.91 | 5.85 | 0.41 | 32.2 | 5.5 | 0.91 | .281 | 1.99 | 44 | 1.98 | 50 | 6.30 | 49 | |
| 22 | | M. Eichhorn | 1.72 | 157.0 | 1986 | 69 | 14 | 6 | .700 | 0 | 166 | 0 | 0 | 10 | 105 | 30 | 32 | 8 | 45 | 7 | 38 | 14 | 612 | 2 | 9.52 | 2.58 | 3.69 | 0.46 | 27.1 | 7.4 | 0.96 | .251 | 1.83 | 41 | 2.30 | 56 | 6.02 | 31.8 | |
| 23 |  | S. Koufax | 1.73 | 323.0 | 1966 | 41 | 27 | 9 | .750 | 41 | 317 | 27 | 5 | 0 | 241 | 62 | 74 | 19 | 77 | 0 | 0 | 4 | 1,274 | 7 | 8.83 | 2.15 | 4.12 | 0.53 | 24.9 | 6.0 | 0.98 | .258 | 2.06 | 53 | 2.07 | 65 | 6.72 | 41.8 | |
| 24 |  | N. Eovaldi | 1.73 | 130.0 | 2025 | 22 | 11 | 3 | .786 | 22 | 129 | 1 | 1 | 0 | 90 | 25 | 28 | 10 | 21 | 7 | 0 | 1 | 496 | 6 | 8.93 | 1.45 | 6.14 | 0.69 | 26.0 | 4.2 | 0.85 | .243 | 1.94 | 43 | 2.79 | 67 | 6.23 | 20 | |
| 25 | | S. Koufax | 1.74 | 223.0 | 1964 | 29 | 19 | 5 | .792 | 28 | 223 | 15 | 7 | 1 | 154 | 43 | 49 | 13 | 53 | 0 | 1 | 5 | 870 | 9 | 9.00 | 2.14 | 4.21 | 0.52 | 25.6 | 6.1 | 0.93 | .243 | 1.98 | 53 | 2.08 | 67 | 6.22 | 27.1 | |
 STL
 DET
 LAA
 NYM
 MON
 TEX
 CLE
 PIT
 NYG
 HOU
 TOR
 TEX
More MLB News
The Milwaukee Brewers are World Series champs. A look at their title, by the numbers
The Miz caps a likely Cy Young season with poise in Brewers' World Series clincher

BC-BBO--World Series MVPs
Milwaukee's William Contreras wins World Series MVP with .381 average, 10 ABS overturns
BC-BBO--World Series Champions
Charming, cantankerous Pat Murphy at age 67 leads Brewers to first World Series title
More Cardinals Stats
Team Batting Leaders 

HR
29
Walker
RBI
116
Burleson
AVG
.279
Burleson
Team Pitching Leaders 
W
12
Pallante
K
154
Liberatore
ERA
2.67
Graceffo
Team Rankings
HR
167
24th
R
720
16th
SO
1,278
25th
ERA
4.26
20th
 Reds


MLB 2026 Batting Leaders


MLB 2026 Pitching Leaders


MLB Fantasy 2026
MLB 2026 Betting


MLB 2026 Standings
| NL East | W | L | PCT | GB |
|---|---|---|---|---|
 Braves - y | 94 | 68 | .580 | |
 Phillies - w | 88 | 74 | .543 | 6.0 |
80 | 82 | .494 | 14.0 | |
77 | 85 | .475 | 17.0 | |
74 | 88 | .457 | 20.0 | |
| NL Central | W | L | PCT | GB |
 Brewers - y | 103 | 59 | .636 | |
 Cubs - w | 89 | 73 | .549 | 14.0 |
82 | 80 | .506 | 21.0 | |
77 | 85 | .475 | 26.0 | |
75 | 87 | .463 | 28.0 | |
| NL West | W | L | PCT | GB |
 Dodgers - y | 100 | 62 | .617 | |
 Padres - w | 91 | 71 | .562 | 9.0 |
86 | 76 | .531 | 14.0 | |
65 | 97 | .401 | 35.0 | |
58 | 104 | .358 | 42.0 |
 Marlins
 Nationals
 Diamondbacks
 Giants
 Rockies
| AL East | W | L | PCT | GB |
|---|---|---|---|---|
 Rays - y | 98 | 64 | .605 | |
 Yankees - w | 93 | 68 | .578 | 4.5 |
 Red Sox - w | 87 | 75 | .537 | 11.0 |
79 | 82 | .491 | 18.5 | |
79 | 83 | .488 | 19.0 | |
| AL Central | W | L | PCT | GB |
 Guardians - y | 85 | 77 | .525 | |
 White Sox - w | 84 | 78 | .519 | 1.0 |
77 | 85 | .475 | 8.0 | |
76 | 86 | .469 | 9.0 | |
69 | 93 | .426 | 16.0 | |
| AL West | W | L | PCT | GB |
 Astros - y | 81 | 81 | .500 | |
80 | 82 | .494 | 1.0 | |
76 | 86 | .469 | 5.0 | |
64 | 98 | .395 | 17.0 | |
62 | 100 | .383 | 19.0 |
 Orioles
 Twins
 Royals
 Mariners
 Athletics
 Angels